
Data Center Fabric Manager Professional User Manual v10.3.X (53-1001355-01, November 2009)

216 DCFM Professional User Manual
53-1001355-01
Generating a real-time performance graph
7
Generating a real-time performance graph
You can monitor a device’s performance through a performance graph that displays transmit and
receive data. The graphs can be sorted by the column headers. You can create multiple real-time
performance graph instances.
NOTE
To make sure that statistic collection for a switch does not fail, you must configure SNMP credentials
for the switch. For step-by-step instructions, refer to “Configuring SNMP credentials” on page 42.
To generate a real-time performance graph for a device, complete the following steps.
1. Select the fabric, device, or port for which you want to generate a performance graph.
2. Choose one of the following options:
• Select Monitor > Performance > Real-Time Graph.
OR
• Right-click the device or fabric and select Performance > Real-Time Graph.
If you selected a port, the Real Time Performance Graphs dialog box for the selected port
displays. To filter real-time performance data from the Real Time Performance Graphs dialog
box, refer to “Filtering real-time performance data” on page 217.
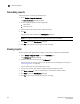
If you selected a fabric or device, the Realtime Port Selector dialog box displays. Continue with
step 3.
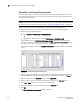
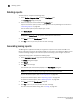
FIGURE 65 Realtime Port Selector dialog box
3. Select the object type (FC Ports, ISL Ports, Device Ports, EE Monitors, GE Ports, FCIP Tunnels,
Managed HBA Ports, 10GE Ports) by which you want to graph performance from the Show list.
4. Right-click anywhere in the Available table and select Expand All.
5. Select the ports you want to include in the performance graph in the Available table.
Press Ctrl or Shift and then click to select more than one port.
6. Click the right arrow to move the selected ports to the Selected table.
7. Click OK.
The Real Time Performance Graphs dialog box displays.