
HP Insight Virtualization Manager with Logical Server Management 6.1 User Guide


Meter callout information
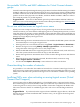
Meter callouts exist only on the Visualization tab. Meter callout information includes:
• Current utilization data for CPU, memory, network, and disk; plus the ability to view
historical data, for example, by linking to Capacity Advisor to display a profile page.
• Information about power consumption for any physical server, including standalone servers,
nPartitions, or server blades.
• Collection interval; which is typically in 5 minute intervals for WBEM/VMM data, but can
vary for agentless data collection.
• Source of the meter data, indicating whether the data comes from the utilization WBEM
provider, VMM, or via agentless data collection.
• Last-updated time of the data collection.
• Error messages (for example, if there was a problem collecting utilization data from the
server), a suggested resolution, and an optional Retry link.
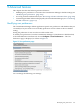
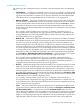
The following figure shows meter callout information for a server blade running on HP-UX.
If the compartment shows a managed workload, links appear that let you view real time and
historical information from the Global Workload Manager (gWLM). For example:
110 Advanced features