
HP Insight Virtualization Manager with Logical Server Management 6.1 User Guide


7
HP SIM system status indicators are the same as the ones that appear on the HP SIM
System Status panel, in the left-hand navigation area. Hover over a status indicator for
descriptive text.
8
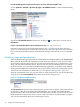
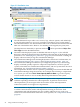
Technology icons provide quick navigation to management tools. Hover over the icon to
see quick information about the management tool that will be launched by clicking the
icon. From left to right, the icons in Figure 3-1 allow you to:
• Access the HP SIM System page
• Launch the HP Integrity Virtual Machines Manager host or VMM host system page
If there are more icons than can appear on a single line, the expand tray icon appears.
You can hide the additional icons by clicking the close tray icon . In the following figure,
clicking the expand tray icon shows two additional icons:
For information on all icons in the Visualization View, see “Compartment details”
(page 29).
9
The expand/collapse icons and , and focus icon are displayed in the top right corner
of a compartment. For information, see “Compartment details” (page 29).
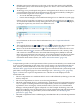
10
Hover over the node information icon to view the attributes of that node. Hover over
the meter callout icon to view the recent utilization metrics for CPU, memory, disk,
and LAN that is obtained from the Virual Machine Management (VMM) for ESX and
Microsoft virtual machines hosts and guests, or from the Utilization Provider for all other
types, depending on what you are viewing. For more information, see the For more
information about meter callouts, see “Meter callout information” (page 110).
Compartment details
Compartments provide a visual representation of the systems and workloads you are authorized
to see on a CMS. Depending on the status of the system, meters can show utilization data for
CPU, memory, network, disk and, in some cases, power settings (see “Reviewing real-time
utilization data” (page 107)). Icons show the technologies associated with each system and provide
quick links to management pages for those technologies (see “Technology icons” (page 32)).
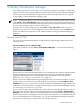
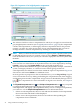
Figure 3-2 shows four top-level compartments in a collection of nodes displayed on the
Visualization tab:
• The first compartment is a standalone HP-UX server with full details (technology icons and
meters) collapsed.
• The second compartment is a Linux server showing full details.
• The third compartment shows a “node hierarchy” with the top-level compartment (in this
case, a Complex containing nPartition subcompartments). The second nPartion curly01 is
expanded to show six Integrity virtual machines. When you first access Virtualization
Manager, subcompartments appear collapsed, as in this example. Technology icons and
meters do not display. You can change the way top-level compartments and subcompartments
display by modifying user preferences (for more information, see “Modifying user
preferences” (page 105)).
• The fourth compartment shows an HP Integrity Virtual Machine Host, with subcompartments
collapsed.
Using the visualization view 29