
HAFM SW 08.08.00 HP StorageWorks HA-Fabric Manager User Guide (AA-RS2CH-TE, August 2006)


HA-Fabric Manager user guide 145
Exporting performance data
To export SAN performance data to communicate issues to the support center, capture network
status, and archive historical data, see ”Exporting and importing data” on page 62 or see the
HAFM online help.
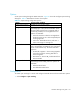
NOTE: Currently, you can export only to the same versions of the application.
Monitoring port performance
You can monitor the performance of switch ports devices in the SAN using the port performance
graph. The graph also shows information about transmit and receive performance.
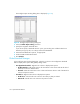
To monitor port performance:
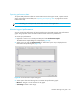
1. Right-click a switch icon on the Physical Map and select Performance Graphs.
The Performance Graph dialog box is displayed (Figure 89).
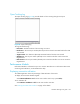
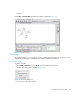
2. Select a port row and click History/Events (or double-click a port row) to display the Port
Performance Graph dialog box (Figure 90).
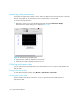
Figure 90 Port Performance Graph dialog box
3. Select options from the following lists to customize the performance graph:
• Measure—Assigns a unit of measure for the graph.
• Time Range—Selects a time range.