
HAFM SW 08.08.00 HP StorageWorks HA-Fabric Manager User Guide (AA-RS2CH-TE, August 2006)


Optional HAFM features144
Monitoring switch performance
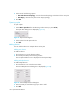
A performance graph shows transmit, receive, and error data from the switch ports to the connected
devices. The graphs can be sorted by the errors, transmit data, or receive data.
To monitor switch performance:
1. Right-click a switch icon on the HAFM Physical Map and select Performance Graphs.
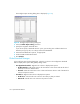
The Performance Graph dialog box is displayed (Figure 89).
Figure 89 Performance graph dialog box
2. Select the type of data to display from the Data list.
3. Select the error data to display from the Errors list.
Collecting performance data
You can collect performance data about your SAN and then view it or export it and distribute the
data to others.
Storing performance data
To store SAN performance data, select Monitor > Performance > Store Data.
Viewing performance data
See the HAFM online help for instructions on how to generate and view HTML reports of
performance data.