
HP Insight Cluster Management Utility v7.1 User Guide

In the central frame, the following tabs are available:
• Instant View
• Table View
• Time View
• Details
• Alerts
For a single node view, the following tabs are available:
• Monitoring
• Details
• Alerts
5.3.3 Global cluster view in the central frame
By default, the central frame displays the monitoring values of the whole cluster. You can return to
this view at any time by clicking CMU Cluster at the root of the node tree. The global cluster view
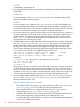
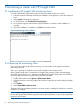
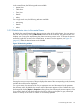
displays one or more pies representing the cluster monitoring sensor value. To choose the sensors
monitored, right-click an item in the central frame. A metrics window appears, see Figure 33
(page 69). Select the desired metric and click OK.
Figure 33 Monitoring window
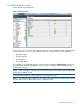
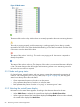
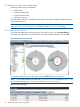
Pausing the mouse on a portion of the pie displays the name of the corresponding node, the status,
and the value of the sensor displayed.
For a given metric, the internal circle of a pie represents zero and the external circle represents
the maximum value. By default, the current value of the metric appears in blue. Default color can
be changed by clicking Option→Properties in the top bar, then selecting the monitor options. Color
for a specific petal can also be changed on the fly by clicking on the petal. A grey colored pie
means no activity on the node or a metric is not correctly updated.
5.3 Monitoring the cluster 69