
HP Insight Control for Linux 6.0 User Guide
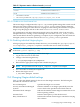
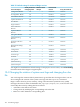

Table 15-1 Supermon metrics collection intervals (continued)
Collection intervalMetric name
%LOADAVECOLLECTIONPERIOD% **avenrun
%MDADMCOLLECTIONPERIOD% **mdadm
* The default is 5 minutes.
**
This value is specified in the /opt/hptc/nagios/etc/nagios_vars.ini file.
15.2.5.1 Global service check timeout limit
The master Nagios configuration file, nagios.cfg, contains global settings that control overall
behavior. One of these settings is the service_check_timeout interval. Nagios limits the
execution time of plug-ins to this interval. If a plug-in is still running when the interval expires,
Nagios stops the plug-in and shows the result as a Service check timeout error.
For configurations with fewer than 256 managed systems, the default value of 180 seconds is
adequate. However, warning or critical messages can occur if the service_check_timeout
interval ends before the metrics gathering is complete. If your configuration has more than 256
managed systems, increase the value for the service_check_timeout parameter.
15.2.6 Disabling individual Nagios plug-ins
All Nagios plug-ins are enabled by default. However, you can modify the /opt/hptc/nagios/
etc/templates/*_template.cfg files to customize the service checks as needed.
IMPORTANT: Do not modify files in the /opt/hptc/nagios/etc directory with file names
of the form *_local.cfg or xc_*.cfg.
To disable a specific Nagios plug-in, follow these steps:
1. Log in as the root user on the CMS.
2. Change to the following directory:
# cd /opt/hptc/nagios/etc/templates
3. Determine the appropriate template file to disable the plug-in.
NOTE: This procedure uses the nagios_template.cfg file as an example.
4. Use a text editor to modify the template file.
5. Restart the Nagios service:
# /etc/init.d/nagios restart
15.3 Changing Nagios default settings
Table 15-2 lists the default settings for the services that Nagios monitors. The following list
describes the columns in Table 15-2:
Service Description Specifies the Nagios service name.
Actively Launched on Managed
System?
Indicates whether or not Nagios periodically runs this
service check at the specified normal check interval.
Maximum Check Attempts Indicates the number of times Nagios examines the service
before reporting a failure.
Normal Check Indicates the frequency of the check interval.
Retry Check Interval Indicates the amount of time Nagios waits before retrying
after a failure.
15.3 Changing Nagios default settings 179