
HP Insight Control for Linux 6.2 User Guide


20 Using graphical tools to monitor managed systems
This chapter addresses the following topics
• “Insight Control for Linux system monitoring overview” (page 171)
• “Nagios overview” (page 172)
• “Using Nagios” (page 175)
• “Services monitored by Nagios” (page 183)
• “Understanding Nagios alert messages” (page 185)
• “Understanding system event log monitoring ” (page 186)
• “Configuring Nagios email alerts” (page 186)
• “Monitoring Metrics in real time” (page 187)
20.1 Insight Control for Linux system monitoring overview
Insight Control for Linux provides a complete monitoring environment for administrators focused
on Linux. Insight Control for Linux monitoring combines best-in-class technologies and open
source packages that Linux administrators commonly use. The prominent packages for Insight
Control for Linux monitoring are:
• Nagios
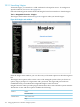
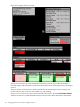
Nagios is a commonly used open source system and network monitoring application
infrastructure. It is a graphical web-based application that provides a variety of system
statistics that you use to monitor the health of managed systems.
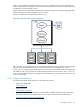
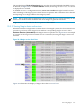
You can configure Nagios to monitor hosts and services that you define. Hosts and services
report data returned through plug-ins. These scripts typically return an ok, warning, or
critical exit status (0, 1, or 2, respectively) and an informational message on stdout.
If problems occur, Nagios alerts you using predefined methods such as email, SMS, or by
invoking site specific notification tools.
• Round Robin Database Tool
The Round Robin Database (RRD) Tool is the open source industry standard, high
performance data logging and graphing system for time series data.
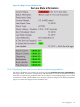
• Supermon
A highly scalable, high-speed monitoring system. Supermon provides all required system
statistics to the Nagios subsystem.
The data that Supermon collects includes system performance sensor and environment data,
such as fan, temperature, and power supply status. This data is collected on a regular basis.
• syslog and syslog-ng
The syslog service runs on each managed system and captures log information.
• Performance Dashboard Tool
The Performance Dashboard tool displays metric data refreshed in one-second intervals in a
graphic ring plots.
Insight Control for Linux gathers data using the platform specific management processor, iLO
or IPMI, as well as OS provided metrics such as load average, nodeinfo, system free space, and
so on. Other information such as syslog alerts is obtained from the /hptc_cluster/adm/
logs/consolidated.log consolidated log file.
20.1 Insight Control for Linux system monitoring overview 171