
HP Insight Control for Linux 6.2 User Guide
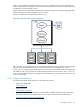
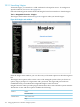
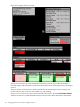
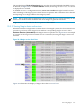

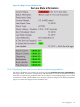
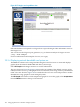

Figure 20-7 Nagios service problems view
Select the link that corresponds to a Nagios host to open the Nagios Host Information view for
that Nagios host.
You can also use the Nagios report generator, nrg, to obtain an analysis of Nagios services:
# nrg --mode analyze
For more information and examples of its use, see nrg(8).
20.3.4 Displaying network bandwidth and system use
The RRDtool software tool is integrated into Insight Control for Linux to create and displays
graphs about the network bandwidth and other system usage.
Select HP Graph in the Nagios menu to access this information.
The view shown in Figure 20-8 (page 181) provides an example of the default overview of the
CMS (host name mercury) with graphs for server allocation, CPU usage, memory, and Ethernet
traffic. The view shown in Figure 20-9 is attached to the overview view and provides a smaller
detailed CPU usage graphs for each managed system.
The HP Graph also features a CPU temperature graph. To access this graph, select temperature
from the Metrics menu at the top of the window.
180 Using graphical tools to monitor managed systems