
HP Insight Control Performance Management 7.3 User Guide
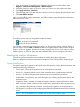

1. From the HP Insight Control/HP Matrix Operating Environment console toolbar, select
Diagnose→Performance Management→Offline Analysis.
2. Select the check box next to a server for which you want to view the performance data.
3. Click Apply Selections→Run Now.
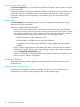
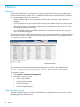
4. Select the start date in the date selection column for a server to display the performance data.
5. Click Start Offline Analysis.
After you select offline analysis parameters, the Offline Analysis page displays the performance
status view for the server.
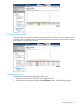
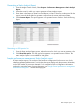
The following icons help you navigate the bottleneck display.
• back to the previous bottleneck
• forward to the next bottleneck
For example, if a status change happens at 6:00 a.m. from green to amber, yellow to amber, or
green to yellow, click the Next or Previous bottleneck navigation button and the Offline Analysis
page for 6:00 a.m. appears. However, if the status changes at 6:00 a.m. from amber to yellow,
amber to green, or yellow to green, the next bottleneck button does not navigate to that time.
Reading the analysis information
The following sections describe various methods of reading the analysis information.
Below are the panes of analysis information that appear on the Online/Offline Analysis page:
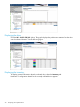
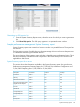
System Details pane
The Systems detail pane appears at the top left side of the browser window below the banner and
provides the following information:
• Server name—Name of the monitored server currently being monitored.
• Server OS—Operating system version of the monitored server currently being monitored.
• Server IP—IP address assigned to the monitored server currently being monitored.
• Sample Rate—The frequency with which the agents are collecting performance data on the
monitored server.
• Samples for Status—Number of samples averaged to determine system performance status.
• Alert—Indicates if alerts will be sent when certain server performance status conditions occur.
• Log—Indicates if the performance data is currently being logged for the monitored server.
• Set Threshold—Provides a link for modifying the performance threshold values for the monitored
server.
NOTE: The Set Threshold link is available only on the Online Analysis page.
Reading the analysis information 21