
HP Insight Control Performance Management 7.3 User Guide
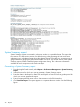
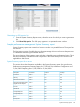
Server Configuration pane
The Server Configured pane is on the left side of the browser window. Use this pane to navigate
system components.
Component performance and status information appear in a hierarchical tree with nodes for each
level of the component. This frame provides a view of the server, processors, memory, network
connections, storage, host bus components, virtual machine guest, and virtual machine host
components.
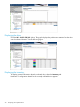
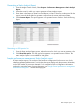
Results pane
The Online Analysis pane displays the status, inventory, and graphical representation for the
selected server and its components.
Three tabs provide the following information:
• Status—Performance counters metrics, associated with the selected component. The table
provides the average, maximum, minimum, and last (current) values for the counters. A status
icon indicates the performance of the component. The icon changes as the level of severity is
indicated as the status changes from normal to major. The Status tab includes:
◦ Analysis Explanation—Why a bottleneck exists.
◦ Recommendation—Possible actions to relieve the bottleneck.
◦ Configuration Issues—Details of any hardware or agent configuration issues that are
detected.
• Graph—Graphical representation of the performance metrics associated with the selected
component. The graph, changes as the values change, and shows the number of samples as
set on the Monitoring Administration page.
• Inventory—Hardware or configuration details of the selected component configuration, such
as the processor or the NIC configuration.
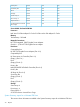
Graphical display
The graphical display provides a graphical representation of the performance metrics of the
monitored server.
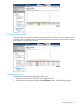
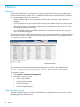
Expanding the local storage
To expand the tree structure for storage component, click the + icon next to Storage in the
configuration tree, and then select the storage node. See the following figure:
22 Analyzing server performance