
HP Integrated Archive Platform Performance Graphs and Counters Whitepaper


15
Summary
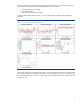
In summary, this document examined the performance graphs and counters available to the IAP.
The performance counters are split into two categories: Platform Store and Indexing, and System
Monitoring. Platform Store and Indexing provides counters and graphs that monitor the store
performance of the IAP. The System Monitoring performance provides counters and graphs to monitor
of each individual server’s system performance and resource utilization. Performance graphs can be
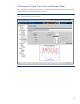
generated from the last 15 minutes to the previous year at intervals ranging from 5 minutes to yearly.
Custom date and time ranges can also be defined.
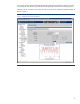
The Store and Indexing performance graphs can be used for trend analysis, providing useful data
when planning preventive maintenance and upgrades. These counters can also aid in forecasting
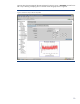
storage requirements for capacity planning. The system monitoring performance graphs can help in
identifying potential problems before they reach a critical stage. Historical data can be compared to
current operating conditions to identify performance metrics that are out-of-spec for normal operating
parameters.