
9.5.01 HP P4000 SAN Solution User Guide (AX696-96168, February 2012)


For more information about the performance monitor window, see the following:
• “Performance Monitor toolbar” (page 212)
• “Performance monitor graph” (page 212)
• “Performance monitor table” (page 213)
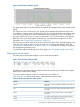
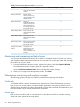
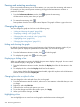
Performance Monitor toolbar
The toolbar lets you change some settings and export data.
Figure 101 Performance Monitor toolbar
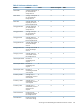
DefinitionButton or Status
1. Performance Monitor status
• Normal—Performance monitoring for the cluster is OK.
• Warning—The Performance Monitor is having difficulty
monitoring one or more storage systems. Click the
Warning text for more information.
Opens the Add Statistics window.2. Add Statistics
Toggles the graph display on or off.3. Hide Graph/Show Graph
Restarts monitoring after pausing.4. Resume Monitoring
Temporarily stops monitoring.5. Pause Monitoring
Numeric value for the data update frequency.6. Sample Interval
Unit of measure for the data update frequency, either
minutes or seconds.
7. Sample Interval Units
8. Export status
• N/A—No export has been requested.
• Sample interval and duration—If you have exported
data, sample interval and duration display.
• Paused—You paused an export.
• Stopped—You stopped an export.
• Warning—System could not export data. Click the
Warning text for more information.
• Error—System stopped the export because of a file IO
error. Try the export again.
Displays window to set up exporting of data to a comma
separated values (CSV) file. Button changes to Resume
Export Log when export is paused.
9. Start Export Log/Resume Export Log
Temporarily stops exporting of data.10. Pause Export Log
Stops the exporting of data.11. Stop Export Log
Shows the progress of the current data export, based on
the selected duration and elapsed time.
12. Export Log Progress
Performance monitor graph
The performance monitor graph shows a color-coded line for each displayed statistic.
212 Monitoring performance