
HP Integrity Essentials Global Workload Manager: Workload Management for HP Integrity Virtual Machines


10
Note also that gWLM provides helpful monitoring tools from the gWLM CLI:
• /opt/gwlm/bin/gwlm monitor
Displays policy, workload, and SRD statistics.
• /opt/gwlm/bin/gwlmreport
Provides “topborrowers” and “resourceaudit” reports and more.
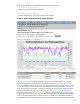
Figure 1 - Historical Data Report for Virtual Machine
The horizontal red line indicates the maximum amount of cores that this workload can consume,
which corresponds to its virtual machine (compartment) configuration of 2 vCPUs. The horizontal
green line indicates the minimum amount of cores that must be allocated at all times, which is about
0.1 for the workload or 0.05 cores for each vCPU configured for that workload. The dark blue line
shows the percentage (% Utilization, measured on the vertical axis on the right of the graph) of the
workload’s allocated cores being used at any given time. The lighter blue line tracks the actual
amount of cores consumed. The tan and orange lines show, respectively, the amount of cores the
workload actually has (size) at any given time and the amount gWLM allocated to it after arbitrating
resource requests from the policies of all the workloads in the SRD. For compartments operating in
managed mode (and therefore, all virtual machine workloads), these lines converge as shown in this