
Best Practices for Integrity Virtual Machines


5/19
Monitoring
Since each VM is manifested as a UNIX process running on the VM Host, the physical resources –
including CPU, I/O, etc. – consumed by a given VM can be identified by monitoring the process
associated with that VM. These processes have the executable name hpvmapp and typically have
the option –d whose argument name is the name of the VM. For example, the process with
command ‘hpvmapp –d vm01’ corresponds to the virtual machine named ‘vm01.’
Simple tools such as ps and top can be used on the VM Host to monitor a virtual machine by
identifying the process ID for a given VM. For example, the PID for some VM can be identified from
the output of ‘ps –fu root | grep hpvmapp’ and then used with top to identify the resources
being consumed by that VM.
More elegant solutions can be achieved with tools such as HP’s GlancePlus performance monitoring
tool. Each VM may be defined as an OpenView application by creating an application definition in
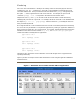
the OpenView parameter file /var/opt/perf/parm. For example, inserting the following application
definitions for the virtual machines named vm01, vm02, and vm03 in /var/opt/perf/parm
enables GlancePlus to identify them as applications:
application vm01
cmd = *hpvmapp -d*vm01
application vm02
cmd = *hpvmapp -d*vm02
application vm03
cmd = *hpvmapp -d*vm03
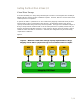
This makes it easy to track the resource utilization of each VM through Glance’s Application List
reporting functionality.
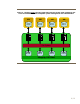
Figure 1 provides an example of GlancePlus visualization of VMs using the application definitions
mentioned above.
Figure 1 - GlancePlus can be used to monitor VMs as Applications