
HP OneView 1.05 User Guide


26 Monitoring data center status, health, and performance
This chapter describes the recommended best practices for monitoring data center status, health,
and performance using HP OneView.
26.1 Daily monitoring
As part of the daily monitoring of your data center, it is important to be able to quickly scan the
appliance-managed resources to assess the overall health of your data center. By reviewing the
UI screens, you are able to rapidly analyze the state and condition of your data center.
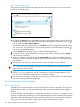
26.1.1 Initial check: the Dashboard
The Dashboard provides an at-a-glance visual health summary of the appliance resources you are
authorized to view. The Dashboard can display a health summary of the following:
• Server Profiles
• Server Hardware
• Enclosures
• Logical Interconnects
• Appliance alerts
The status of each resource is indicated by a color: green indicates OK, yellow indicates a warning,
and red indicates a critical condition. You can link to the resource screens in the UI for more
information by clicking on the status icons displayed for each resource.
To learn more about the Dashboard screen, see “Using the Dashboard screen” (page 193).
26.1.2 Activities
The Activity screen provides a log of health and status notifications. The appliance verifies the
current activity of resources in your environment, and posts alerts to the Activity screen and to the
associated resource screens for you to review.
The Activity screen is also a database of all tasks that have been run, either synchronously or
asynchronously, and initiated by the user or system. It is similar to an audit log, but provides more
detail and is easily accessed from the UI.
26.1.3 Utilization graphs
For certain resources, the appliance collects CPU, power, and temperature utilization statistics from
management processors (the iLO, Onboard Administrator, and iPDU). Utilization graphs enable
you to understand recent utilization statistics relative to available capacity, see utilization trends
over time, and see historical utilization over time. Hover over the utilization area in the UI to display
tool tips.
The Enclosures screen View historical metrics of power consumption (average,
peak, and power cap) and temperature.
The Server Hardware screen View historical metrics of CPU utilization/CPU frequency,
power consumption (average, peak, and power cap), and
temperature.
The Power Delivery Devices screen View historical metrics of power consumption (average and
peak and previous 5 minutes, previous 24 hours).
The Interconnects screen View uplink port statistics of the bit transfer rates (transmitted
and received).
To learn more about utilization graphs, see “Monitoring power and temperature” (page 197).
26.1 Daily monitoring 185