
HP OneView 1.05 User Guide
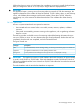
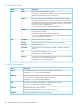
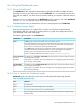

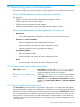
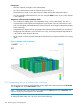
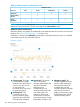

Table 13 Utilization statistics gathered by resource
Utilization metric
CustomTemperaturePowerCPUResource
✓✓✓Enclosures
✓Power Delivery
Devices
✓✓✓✓Server
Hardware
NOTE: You can use the Interconnects screen to view utilization graphs that display data transfer
statistics for interconnect ports. See the online help for the Interconnects screen.
Utilization statistics and licensing
Utilization statistics and graphs are disabled for server hardware that does not have an iLO license
assigned. See “About licensing” (page 129) to learn more.
If utilization is disabled, the Utilization panel displays a message stating the reason it is disabled
in the details pane for the unlicensed resource.
Utilization graphs
431
Primary graph: The large
primary utilization graph
Navigation graph: The
navigation graph below the
Vertical axis: The vertical
axis on the primary
primary graph displays theutilization graph depicts thedisplays metric data (vertical
maximum time interval ofinterval for the metricaxis) for your devices over
available data. Use thedisplayed in thean interval of time
navigation graph to select thecorresponding unit of(horizontal axis) using a line
to graph data points. time interval you want tomeasurement down the left
display in the primary graphside of the graph. The
2
Horizontal axis: The
horizontal axis on the by highlighting the interval
with your pointing device.
interval for each unit of
measurement is fixed andprimary utilization graph
cannot be changed. Graphsdepicts the time interval for
that display two metrics withthe data being displayed,
200 Monitoring power and temperature