
HP StorageWorks SAN Virtualization Services Platform administrator guide (5697-0109, July 2009)


Using Perfmon counters to log
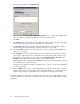
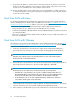
Perfmon has many counters available, but your data becomes harder to monitor if you have to sort
through too much. To learn about a counter, select it, and then click the Explain button.
Choose the category from the Performance object drop-down menu. Some counters with similar
purposes (for example, Processor: %, Processor Time, and System: Processor Queue Length) are in
different categories.
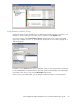
Remember to select Total when the option is available, unless you are interested in the % Disk Time
for an individual LUN (or similar situations). There may not be a Total available even with multiple
items listed. In this case you can select the All instances radio button.
Once you have your Perfmon data, you can analyze it with a Perl script tool or Microsoft Excel.
HP StorageWorks SAN Virtualization Services Platform administrator guide 63