
HP StorageWorks SAN Virtualization Services Platform Administrator Guide (5697-0934, May 2011)
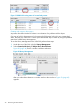
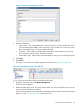
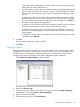

6. In the drop-down box under select counters from computer, choose or enter the IP address of
the VSM server that is to be monitored. Add any counters you want to monitor.
7. Click Close.
8. In the Interval field, select the time interval for data to be sampled. You can start with 15
seconds, but you may need to occasionally use 3 seconds for more precise data.
9. In the Run As: field, enter the user name and password needed to access the VSM. Failing to
enter this data will not give Perfmon the necessary permissions to collect data.
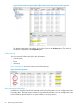
10. Click the Log Files tab and choose the log file type. You may try “Text File (Comma delimited),
which is a .csv file type.
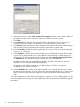
11. Select Configure to choose where to save the file, how to name the file, and any file size limits.
A good way to adjust the file size is to have Perfmon collect the data is smaller amounts. If
you choose a file size limit, data can be lost unless you select Stop log when log file is full on
the Schedule tab. The default directory for Perfmon files is the Perflogs folder.
By default, Perfmon files are numbered from 000001–999999 in the order the data was
collected. You can change where numbering begins.
Comments can be added to remind you of what the log is to collect, or for special
configurations you want to document.
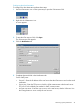
12. Use the Schedule tab to set the log to begin manually or at a specific time. Be sure to select
the date as well as the time. You may want to stop logs automatically after 6 or 12 hours and
begin new files to keep data more organized. Ensure you select the hours setting and not
days.
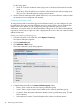
Once the configuration is done, the log will display as a green icon if it is collecting data or a red
icon if the program is not running. To run a stopped test, select it from the list and click the triangular
play button.
50 Monitoring the SVSP domain