
HP Storage Essentials SRM 6.0 User Guide for Enterprise Edition and Standard Edition SRM Software (July 2008)


HP Storage Essentials SRM 6.0 User Guide 367
To print the elements in Capacity Manager:
1. Access Capacity Manager as described in ”Accessing Capacity Manager” on page 357.
2. If the topology spans more than one screen, arrange the elements so they are closer together,
preferably on one screen. To move an element, click the button and then the element you want
to move. Drag the element to its new location. Moving elements closer together prevents the
printout from appearing too stretched.
3. Click the button. For more information, see ”Configuring Print Settings” on page 179.
Viewing Capacity Charts
Capacity Manager provides a graphical representation of the capacity history of an element, such
as port summary information for switches.
The following lists the types of capacity charts available:
• Volume
• Aggregate
• Quota
• Snapshot
You can manipulate the charts, so they show a different reporting period and frequency. For
example, you could show the capacity of a host over the past 24 hours with an hourly monitoring
frequency.
Keep in mind the following:
• Verify that the performance collector for the element is enabled (Optimize > Storage Essentials >
Performance Data Collection). See ”Managing Performance Collection” on page 217 for more
information about enabling performance collectors.
• An hourly roll-up of capacity chart data occurs daily at 2 a.m. Capacity chart data is not
available until after Discovery Data Collection is performed and the hourly roll-up occurs.
• Switches and storage systems display data from the last time Discovery Data Collection was
performed.
• If you see the message “There is not enough data to produce a chart [chart_title] at this time,”
lessen the frequency option, so that the amount of time listed in the Frequency menu has passed
before you view the chart again. For example, if the Frequency menu displays hourly, you need
to wait an hour for data to appear in the chart.
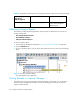
To find the performance of an element:
1. Access Capacity Manager as described in ”Accessing Capacity Manager” on page 357.
2. Click the element whose capacity history you want to see.
3. In the bottom split pane, click the Chart tab.
4. In the lower-middle split pane, click a report title.
The chart for the monitoring option is displayed in the lower-right pane.