
HP Storage Essentials SRM 6.0 User Guide for Enterprise Edition and Standard Edition SRM Software (July 2008)


Viewing Performance Data398
Comparing the Performance of Different Elements
Use Performance Manager to compare the performance of different elements. Let's assume you
want to compare the physical memory used on different hosts, you would do the following:
1. Access Performance Manager as described in ”Accessing Performance Manager” on
page 394.
2. Click the element in the topology whose performance you want to see.
In this example, let's assume you clicked a host named Cortez.
3. Select a component of the element.
In this example, let’s assume you selected Cortez under the Application Path node.
4. Select the graph monitoring option you want to see on the Monitoring tab, located in the lower
pane.
Let's assume you selected Physical Memory Used (%).
5. Scroll to the bottom of the storage tree in the lower-left pane.
6. Expand the All Elements node by clicking the (+) symbol next to the node name.
7. Expand the node for the host you want to compare.
For example, if you want to compare a host name HostA against Cortez, you would expand the
following nodes in order: All Elements > Hosts > HostA > Element Paths > Application Path.
8. Select the same type of component you selected previously for Cortez.
9. Select the same type of graph monitoring option in the left pane.
For example, if you selected “Physical Memory Used (%)” for the first element, you must select
the same option for the other elements. You cannot select “Physical Memory Used (%)” for the
first element and then “Processor Utilization (%)” for the second element. This is because these
two options measure different types of data.
Performance Manager displays information for the different elements in the same graph.
10.Repeat steps 7 through 9 for each host you want to compare against Cortez.
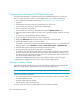
Viewing Summary Charts
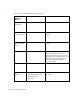
Performance Manager provides summary charts which display a single line that summarizes the
values for a single statistic. Multiple statistics can be shown with multiple lines.
NOTE: You cannot see more than one element at a time on a chart that has multiple elements.
The line has the following attributes:
• The vertical length of the line indicates the minimum and maximum value of the statistic within
the selected data time frame.
• The green marker marks the median.
• The blue marker marks the average value.
Summary charts are currently not supported for real time performance display.