
HP Storage Essentials V5.1 User Guide Second Edition (Linux Release) (T4283-96056, November 2006)

Viewing Performance Data550
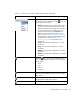
• If you see “There is not enough data to produce a chart [chart_title] at this time.” message,
lessen the frequency option, so that the amount of time listed in the Frequency drop-down menu
has passed before you view the chart again. For example, if the Frequency menu displays
hourly, you need to wait an hour for data to appear in the chart. If the frequency option is
Default, the information is displayed according to the interval of the performance collector that
gathers information for the graph. For example, if you set the collector for the graph to every 15
minutes and the period set to Last Hour, the default setting displays four data points in the
graph. See ”Managing Performance Collection” on page 227 for more information about
setting the performance collectors.
• Verify the performance collector for that element is enabled. See ”Managing Performance
Collection” on page 227 for more information about enabling performance collectors.
• If you select the Default option from the Frequency combo box in Performance Manager and
the maximum number of data points is more than 20, the management server displays statistics
averaged over a three-minute interval. All data points collected within the three-minute period
are averaged together to display one data point. For example, assume you are viewing the
performance of the read bandwidth on a storage system and you selected the Default option
from the Frequency combo box in Performance Manager. If there are more than 20 data points
within the selected time period, Performance Manager employs an averaging algorithm to return
an averaged representation of data in a three-minute period.
• Direct attached storage ports are not displayed in the storage tree in the bottom left pane.
• Performance Manager is not available to file servers.
• To learn more about the buttons in the toolbar, see ”About the Toolbars in Performance
Manager” on page 551.
• The Aggregated volume and aggregated drive filters are no longer shown for Engenio 5884
storage systems or any of its controllers. These filters were available in builds earlier than 4.0 of
the management server.
IMPORTANT: All collectors are stopped during Discovery Data Collection/Get Details. This means
that during Discovery Data Collection/Get Details data for Performance Manager is not updated.
Historical collectors, such as those available from the Configuration tab, are restarted when they are
stopped during Discovery Data Collection/Get Details. Any charts that were active in Performance
Manager when Discovery Data Collection/Get Details was started are not restarted.
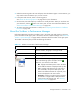
Accessing Performance Manager
To access Performance Manager, click Optimize > Storage Essentials > Performance Manager
or click Tools > Storage Essentials > Home. Then, click Performance Manager in the left pane.
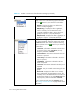
Creating Performance Charts
To create a performance chart for an element:
1. Access Performance Manager as described in ”Accessing Performance Manager” on
page 550.
2. Select the element you want to monitor.