
HP Storage Essentials V5.1 User Guide Second Edition (Linux Release) (T4283-96056, November 2006)

Storage Essentials 5.1 User Guide 551
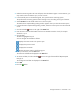
3. Under the Monitoring tab in the lower-left pane, select the element again. In some instances, you
may need to select an element's port, such as a switch.
4. In the pane under the tree, select a monitoring option.
See ”About the Monitoring Options” on page 557 for more information.
5. Use the Chart, Unit and Frequency combo box to modify the chart. When you are done with
your selections, click the button in the lower pane. To learn more about these features, see
”About the Toolbars in Performance Manager” on page 551
6. To monitor more than one element in a chart, see ”Comparing the Performance of Different
Elements” on page 554.
About the Toolbars in Performance Manager
Performance Manager provides two toolbars. One in the upper pane and another in the lower
pane. The toolbar in the upper pane is the same as the one in System Manager. See ”About the
Toolbar in System Manager” on page 258 for information about the toolbar in the upper pane.
The toolbar in the lower pane provides the following information:
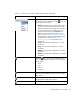
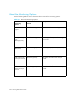
Table 131 Toolbar in Lower Pane of Performance Manager
Icon Description
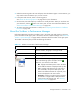
Saves the graph in the cache. If you close the Web
browser window, the graph is no longer saved.
Lets you print a graph.
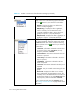
Clears the graph of the elements you have selected.
Lets you determine the type of graph displayed. Select
one of the following options and then click the
button for your selection to take effect:
• Bar - Displays each data point as a bar. The data
for the different elements is displayed side by side.
• Line - Displays each data point as a dot with a
line connected to the previous data points. The
data for the different elements for a specific point
in time is displayed in the same column.
• Summary - Displays a single line that summarizes
the values for a single statistic. Multiple statistics
can be shown with multiple lines. See ”Viewing
Summary Charts” on page 555.