
HP Storage Essentials V5.1 User Guide Second Edition (Linux Release) (T4283-96056, November 2006)

Storage Essentials 5.1 User Guide 555
Viewing Summary Charts
Performance Manager provides summary charts which display a single line that summarized the
values for a single statistic. Multiple statistics can be shown with multiple lines.
The characteristic of the line has the following attributes:
• The vertical length of the line indicate the minimum and maximum value of the statistic within the
selected data time frame.
• The green marker marks the value obtained from the latest time stamp (latest polled value).
• The purple marker marks the average value.
Summary charts are the default type for real time performance display.
To view a summary chart:
1. Access Performance Manager as described in ”Accessing Performance Manager” on
page 550.
2. Create a chart as described in ”Creating Performance Charts” on page 550.
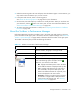
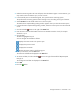
3. Select Summary from the Chart combo box in the lower pane.
4. Click the button in the lower pane for the change to take effect.
Viewing Trending Information for Performance
The management server can display trending information in its reports. For example, you can
configure Performance Manager to display trending information for the next week. This information
can give you an indication of an element's future performance based on past performance.
Keep in mind the following:
• An element's performance can drastically change in the future. Please keep in mind the data
trends are just assumptions and should not be treated as fact.
• Trending requires at least two sets of data gathered within the frequency specified.
To view trending information:
1. Access Performance Manager as described in ”Accessing Performance Manager” on
page 550.
2. Click the element for which you want to see its performance.
3. Under the Monitoring tab in the lower-left pane, select the element again. In some instances, you
may need to select an element's port, such as a switch.
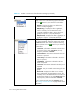
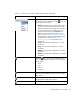
4. In the lower-left pane on the Monitoring tab, click a performance monitoring option.
The performance monitoring options listed in this figure vary according to the type of element.
The monitoring buttons in the figure are for a switch.
5. Click the Edit Chart Property ( ) button in the lower pane.
6. In the Performance Graphic Editing Dialog window, type a number in the Trend field.
The number corresponds to the number of frequency intervals for which the trending information
will be provided. For example, if you type 5 in the Trend field, the chart provides trending