
HP StorageWorks Storage Mirroring Reporting Center user guide (T2558-96071, February 2008)


Storage Mirroring Reporting Center user guide 39
Series
All chart based reports provide the ability to select which series are displayed in the report. By default,
when a chart is displayed, all series in the data set are displayed. You can modify this behavior to only
display certain series by specifying which series you want to display using the Series parameter.
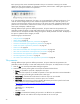
To modify the series selection:
1. Click the Series icon. The Series Editor appears.
2. To enable a series to be displayed, select the check box next to its name in the list of displayed series.
Click
Select All or Deselect All to change the display criteria of all series.
3. Click
Add to add a new series style. Click Edit to edit an existing series style. Click Delete to delete an
existing series style.
4. To save your settings, click
OK. The report is updated to display the selected series.
NOTE: The series editor is not available while the report is being edited.
Trend chart specific appearance parameters
You can specify the parameters for Trend charts:
•
Title—Customize report titles
•
Report Filter—Filter the report results
•
Chart Styles—Configure the colors and fonts used in and around the chart
•
Series Styles—Configure the colors and styles used by a data series in the chart
•
Legend—Configure when legends appear on a chart
•
Series—Select and deselect the series that are displayed in the trend charts
•
Data Views—Configure different views on a Trend chart
Data views
A data view on a chart is the object against which a data series is plotted. A chart can have two data
views. The data view appearance parameter provides the ability to control the following:
• Number of data views to display on the chart
• Which data view against which a series should be plotted
• How the axis within that data view is presented
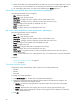
To edit data views:
1. Click
Data Views icon. The Data View Editor appears.
2. Specify the Data Views Editor fields that apply to your report.
•
Number of data views—The number of dataviews to plot. If the fields being plotted have two different
units then it the chart requires two data views. When two views are present the settings for the
second view are enabled.
•
Y-axis Label—The title for y-axis.
•
Use Range—Use range sets the upper and lower limits for the y-axis.
•
Lower limit—Sets the lower limit for the y-axis when range is enabled.
•
Upper limit—Sets the upper limit for the y-axis when range is enabled.
•
Use logarithmic scale—If checked the y-axis is scaled logarithmically.
•
Unit—The base unit for the y-axis.
•
Scale To—The multiplier to scale the y-axis to. If set automatically, the y-axis is scaled to the highest
possible multiplier.
•
Fields in View—List of fields in the view. The include checkbox controls whether the field should be
included when rendering the report. This is useful in dashboard editing where it is not possible to
adjust the report definition and so the only way to drop fields is from this parameter. If the chart has
two views the fields can be moved between the two views.