
HP StorageWorks Storage Mirroring Reporting Center user guide (T2558-96071, February 2008)

Storage Mirroring Reporting Center user guide 45
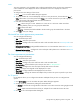
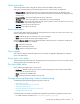
Chart style editor
The chart style editor allows editing of the colors and fonts of different chart elements.
Setting any of the parameter as User Selected picks the color or font from the user preference.
•
Foreground Color—Default foreground color; used by chart elements that are not defined by other
element colors. Foreground color may not be used by some charts. Use series style to change the color
of chart series.
•
Background Color—The main background color of the chart area.
•
Grid Color—Color of the chart grids. This is applicable only to charts with grids.
•
Plot Area Color—Color of the area where the main chart is plotted. In case of 3D chart it is the color of
the walls of the cube containing the 3D chart.
•
Axis Color—Color of the axis and axis text.
•
Axis Font—Font used for the axis text.
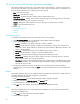
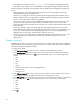
Series style editor
The Series Style Editor allows the changing of the appearance of a Series in the chart. Click on the color
column of the series to edit its appearance.
•
Label—Label of the series for which the color is to be changed.
•
Color—Color to use for the series while plotting the chart.
Select the
Show bar labels check box to display the label of each of the bars in the chart. If the labels are
not displayed, then tooltips are displayed.
•
Add—Add a new series style.
•
Edit—Edit an existing series style.
•
Delete—Delete an existing series style.
Show legend
Sets whether to display or hide the legend. If set to automatic, the legend is displayed if the number of
series is less than twelve.
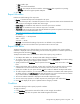
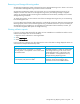
Series style color editor
The Series Style Color Editor allows the changing of the color and style of a series. The Color Style can be
either Solid (one color) or Gradient (3 colors).
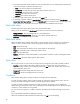
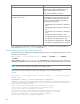
Pie chart fields editor
Allows selecting the fields to plot in the pie chart.
•
Plot Pie per—Whether to plot pie per node or per field. Plotting pie per node requires that the fields
used to plot are all of the same unit.
•
Name—Name of the available field.
•
Plot—If selected, the field is plotted in the pie chart.
Storage Mirroring Reporting Center troubleshooting
Troubleshooting Storage Mirroring Reporting Center consists of:
• “Changing log levels”
• “Removing non-Storage Mirroring nodes”
• “Viewing collector reports”
• “Verifying Storage Mirroring server connectivity”
• “Verifying WMI connectivity”
The following files may need to be gathered to troubleshoot Storage Mirroring Reporting Center issues.
• For install and setup information, see
C:\windows\temp\dtrc_setup.log