HP StorageWorks Storage Mirroring Reporting Center Users Guide HP Part Number: T5437-96025 Published: November 2010
© Copyright 1996-2010 Hewlett-Packard Development Company, L.P. and Double-Take Software, Inc. All rights reserved. Confidential computer software. Valid license from HP required for possession, use or copying. Consistent with FAR 12.211 and 12.212, Commercial Computer Software, Computer Software Documentation, and Technical Data for Commercial Items are licensed to the U.S. Government under vendor's standard commercial license. The information contained herein is subject to change without notice.
Table of Contents Reporting Center overview 3 Reporting Center requirements 4 Installing Reporting Center 5 Reporting Center console 7 Adding servers to the Reporting Center console 8 Adding a Reporting Center server manually 8 Importing a list of servers from the Storage Mirroring Replication Console 8 Managing servers Configuring system settings Types of reports 9 10 12 Dashboards 13 Configuration reports 15 Status reports 16 Performance reports 17 Utilization reports 18 SMRC rep
Reporting Center overview Storage Mirroring Reporting Center is a centralized reporting and analysis solution that allows users to access detailed, custom analyses, reports, and monitoring of all Storage Mirroring servers in the environment. Storage Mirroring Reporting Center provides the ability to show the overall effectiveness of Storage Mirroring protection over time and to analyze trends in a data protection scheme. Storage Mirroring Reporting Center has two components.
Reporting Center requirements The Reporting Center console can be run on any of the Reporting Center server operating systems listed below or on a Windows XP machine. The Reporting Center server must meet all of the following requirements. l l l l Operating system—The Reporting Center server can be installed on any of the following operating systems.
Installing Reporting Center 1. Close any open applications. 2. Start the installation program using the appropriate instructions, depending on your media source. l l CD—Load the Storage Mirroring Reporting Center CD into the local CDROM drive. If auto-run is enabled, the installation program will start automatically. To manually start the program, select Start, Run and specify :\autorun.exe. Web download—Launch the .exe file that you downloaded from the web. 3.
10. Specify if you want the installation to install SQL Server 2005 Express database or if you will be connecting to your own SQL 2000 or 2005 database. Click Next to continue. 11. If you select to used your own existing SQL 2000 or 2005 database, specify the Database Server and the databases that will be used. The Config Database must be at least 150 MB. The Datamine Database must be at least 5GB. If the databases do not exist, they will be created automatically. 12.
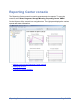
Reporting Center console The Reporting Center console is used to generate and view reports. To open the console, select Start, Programs, Storage Mirroring, Reporting Center, SMRC. On the left pane of the console is a navigation tree. The right pane displays the various reports and status information.
Adding servers to the Reporting Center console Before you can being monitoring a Storage Mirroring server, you must first add it to the Reporting Center console. You can add servers manually or by importing them from the Storage Mirroring Replication Console. Adding a Reporting Center server manually 1. Right-click Storage Mirroring servers in the tree and select Configuration, New, New Node. 2. Specify the Name, which is the Storage Mirroring server that you want to monitor.
Managing servers To help you manage your servers, you can create groups, assign and unassign servers to groups, edit servers, and delete servers. l l l l Creating a group—Right-click Storage Mirroring servers in the tree and select Configuration, New, New Group. Specify a Name and a Description, and click OK. Once the group is created, you can add servers to the group or assign servers to the group. Assigning a server—Assigning a server makes it visible in the console.
Configuring system settings There are a number of system-wide settings that control Reporting Center. To view or modify these settings, select File, System Settings.
Mail Subject The default subject line for e-mail alerts SNMP, Enable SNMP Alerts Enables SNMP traps for alerts SNMP, Server The hostname of the SNMP server Logging, Log Directory Location of the Reporting Center server and collector log files. The directory must already exist or logging will not occur. Logging, Server Log Level The verbosity level for the log file for Reporting Center server. Info includes fatal issues, errors, and warnings. Changing this value may affect performance.
Types of reports There are several categories of reports available and different types of reports within each category. After you create a report, you can customize the appearance to suit your preferences and needs. Click on a link below to view the different types of reports within that category. l l l l l l Dashboards—These reports provide general utilization and overview information.
Dashboards There are four dashboards that provide general utilization and overview information. Click on any of the components within a dashboard to see that single component in a larger view. l l Server Utilization—This report provides utilization data for the processor, memory, network interface, and file system. Connections—This report provides the following connection information.
l l Transmission—This report provides transmission amounts, transmission speeds, and network interface utilization. Server Performance—This report provides monitor status, source queue performance, target queue performance, and transmission rate.
Configuration reports There are seven configuration reports that provide configuration information for the server and the Storage Mirroring connection. l l l l l l l Server—This report lists the server, IP address, the version, activation code, memory limit, disk limit, minimum free disk space, e-mail configuration, and failover configuration.
Status reports There are five status reports that provide status information for the server and the Storage Mirroring connection. l l l l l Connections—This report lists the source, target, replication set, the state of replication, the state of mirroring, the state of transmission, the target paused state, the connected since date and time, and the length of time the connection has been running. Monitors—This report displays the failover monitor status.
Performance reports There are three performance reports that provide performance statistics for Storage Mirroring queuing and transmission. l l l Source Queue—This reports shows the amount of mirror, disk, memory, replication, and total data in queue. Target Queue—This report shows the amount of disk, memory, and total data in queue. Transmission—This report shows the data transferred, transmitted, and the transmission rate.
Utilization reports There are four utilization reports that provide server utilization information. l l l l File System—This reports lists file system utilization, used space on each volume, and free space on each volume. Memory—This reports lists utilization, used memory, available memory, and kernel memory. Network Interface—This reports lists incoming utilization for each network interface. Processor—This report lists CPU utilization and DoubleTake.exe CPU utilization.
SMRC reports There are two Reporting Center reports that provide errors and alerts on Reporting Center processing. l Data Collection Errors—This reports lists and errors generated during the Reporting Center data collection process. The following are some common errors and why they are caused.
l l l l l l l Network utilization—This alert identifies when the network utilization is within the specified percentage. Network errors—This alert identifies if the network has more than the specified percentage of packet errors Connection—This alert identifies if any Storage Mirroring connections from monitored Storage Mirroring source servers are lost. Monitor—This alert identifies if any monitored Storage Mirroring source servers failover.
Creating, printing, e-mailing, and saving reports 1. In the navigation tree, highlight the group or server that you want to create a report for. Select multiple groups or servers by using the Control key and highlighting the groups or servers. 2. Above the right pane of the Reporting Center console, select the time period for the report in the Window drop-down list. If you select Calendar Defined, click on the calendar icon to open the calendar view for date selection. 3.
Scheduling reports You can schedule when reports are automatically generated. 1. Select Tools, Scheduled Report Editor. 2. Specify a Name to identify the scheduled report and, if desired, an optional Description. 3. Select your Schedule from the drop-down list. Click Edit to create, modify, or delete the schedules in the list. a. On the Schedule List dialog box, click New to create a new schedule. b. Specify a Name for the schedule. c.
d. After you have selected all of the days and times for the report to run, click OK. e. Click Close to return to the Scheduled Report Editor. 4. Specify a User with privileges to create the report. 5. Under Publish Settings, select the report output to use for the scheduled report. a. To create a new output, select Add. b. Specify the Report Format (.html web page, .jpg graphic, .csv commaseparate file, or .pdf portable document format). c. If you selected to create a .
10. Select the group(s) and/or server(s) that you want to generate the scheduled report for. 11. Click Save in the toolbar. 12. Repeat these steps for any additional scheduled reports. When you have finished, close the Scheduled Report Editor.
Customizing report appearance You can customize the appearance of all reports, except for the dashboard reports. To customize the report appearance, use the toolbar associated with the selected report type. To view the toolbar for a report, click the small arrow in the upper left corner of the report pane. The appearance toolbar icons will vary depending on the type of report you are viewing and the style of the table.
Area Chart Displays the data as shaded areas Bar Chart Displays the data in vertical bars Cell Styles Controls the colors in table cells. You can set the foreground and background colors. You can also define field conditions and apply colors to those specific conditions.
Horizontal Bar Chart Displays the data in horizontal bars Legend Settings Controls the legend display and position Pie Chart Displays the data in a circular pie chart Refresh Settings Sets refresh settings for the report. You can specify user settings that apply to all reports or settings for each report individually.
Table Summary Defines summary rows to be added to a table Title Defines the title of the report Trend Chart Displays the data as a line graph X Axis Controls the x-axis labels Y Axis Controls the y-axis labels Z Axis Controls the z-axis labels Customizing report appearance Page 28 of 35
Troubleshooting l l Logging level—By default, all processes log only errors and warnings. This may not be enough information to troubleshoot difficult problems. You can change the log levels through the system settings to capture additional information to help you identify any problems. Log files—The following files may need to be gathered to troubleshoot Storage Mirroring Reporting Center issues. l l Configuration—See controller.xml in the Reporting Center install location.
l l Testing WMI connectivity—To test WMI connectivity between Reporting Center and a Storage Mirroring server, select Start, Run, and enter the command WBEMTest. On the Windows Management Instrumentation Tester, click Connect. Modify the Namespace to \\server_name\root\cimv2, where server_name is the name of the Storage Mirroring server. Specify a User (domain\user) with access to the Storage Mirroring server and the Password associated with that user. Click Connect.
Index 3 3D bar chart 25 settings 25 A add servers 8 alerts SMRC report 19 appearance 25 area chart 26 assign server 9 B bar chart 26 C cell styles 26 chart data 26 labels 26 rotation 26 styles 26 config database configuration reports 5 12, 15 connections configuration report 15 dashboard 13 status report 16 Index Page 31 of 35
connectivity console 29 3, 7-9 create report 21 customize report appearance 25 D dashboards 12-13 data collection errors SMRC report 19 system settings 10 data pruning 10 data views 26 datamine database DCOM 5 29 delete server 9 detailed table 26 E e-mail 10, 21 F file system configuration report 15 status report 16 utilization report 18 filter 26 G groups Index 9 Page 32 of 35
H horiztonal bar chart 27 I import servers 8 installation 5 L legend settings logging 27 10, 29 M memory configuration report 15 status report 16 utilization report 18 monitoring limits 29 monitors status report 16 N network interface configuration report 15 utilization report 18 nodes 9 O operating system configuration report overview 15 3 P performance reports Index 12, 17 Page 33 of 35
pie chart 27 print report 21 processor configuration report 15 utilization report 18 protected time status report 16 R refresh settings reports requirements reset 27 12, 21, 25 4 27 S save report 21 schedule reports 22 series styles 27 server 3 configuration report 15 performance dashboard 13 utilization dashboard 13 SMRC reports source queue performance report SQL Server 12, 19 17 4 stacked area chart 27 bar chart 27 status reports 12, 16 surface chart 27 system settings
T table data 27 styles 27 summary 28 target queue performance report 17 title 28 transmission dashboard report 13 performance report 17 trend chart 28 troubleshooting 29 U unassign server utilization reports 9 12, 18 W WMI 29 X x axis 28 Y y axis 28 Z z axis Index 28 Page 35 of 35