
HP StorageWorks XP24000/XP20000 Continuous Access Journal Software User Guide (T5278-96048, November 2011)
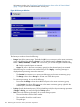
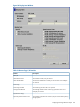
3. In the Display Item window (see “Display Item Window” (page 199)), select an appropriate
option in Select Volume:
• To view I/O statistics for all LDEVs to be monitored in the storage system, select All
Volumes.
• To view I/O statistics for a specific journal group, select JNL Group, and then enter a
journal group number (00-FF). If you specify an unused journal group, the graph is not
available.
• To view I/O statistics for a specific LU, select Volume, and then specify the desired LU
by selecting a port (CL1-A to CLG-R) and entering the GID (00-FE) and LUN (00-7FF).
Note: When you click Volume, the LDKC number, the CU number, and the LDEV number
appear above the graph. If the volume is an external volume, the # symbol appears after
the device ID. For detailed information about external volumes, see the HP
XP24000/XP20000 External Storage Software User Guide. If an X is added to the end
of the device ID (for example, 00:00:3C X), the LDEV number indicates an XP Thin
Provisioning virtual volume. For detailed information about virtual volumes, see the HP
XP24000/XP20000 Thin Provisioning Software User Guide.
4. In the Monitor Data box, select the I/O data that you want to view on the graph. You must
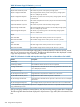
select at least one box. “Remote Copy I/O Statistics” (page 199) describes the I/O data.
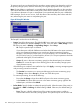
5. Click Set to close the Display Item window. The Usage Monitor window now shows a graph
of the selected I/O data for the selected LU(s).
To enlarge the graph, right-click the graph, and select Large Size. To return the graph to normal
size, right-click the graph, and select Normal Size.
To close the usage monitor graph, right-click the graph, and click Close. To close all graphs, click
Close All. The usage monitor graph closes automatically in the following cases:
• When you select another tab
• When you select another program product
• When you exit the Remote Web Console software
198 Usage Monitor Operations