
HP StorageWorks Enterprise File Services WAN Accelerator 3.0.4 Management Console user guide (AG421-96002, March 2007)

HP STORAGEWORKS EFS WAN ACCELERATOR MANAGEMENT CONSOLE USER GUIDE 189
3 CREATING HP EFS WAN
A
CCELERATOR REPORTS AND
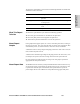
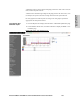
A diamond icon above the top margin of the graph points to the value on the x-axis (the
time) at which the peak occurred.
A diamond icon outside the right margin of the graph points to the value on the y-axis
(for example, the percent) that is the average value for the time period selected.
Pie chart graphs do not indicate peaks or averages. Pie chart graphs represent the
aggregate for the time period selected.
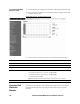
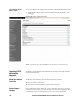
To create the CPU
Utilization report
1. Click the Reports tab to display the Performance - Bandwidth Optimization page.
2. Under Health in the left menu, click CPU Utilization to display the Health - CPU
Utilization page.
Figure 3-19. Health - CPU Utilization Page.