
HP StorageWorks P9000 Performance Advisor Software v5.3 User and Troubleshooting Guide (T1789-96322, August 2011)
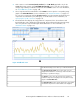

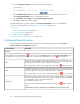

The Component Information section, where the busiest and least
busiest components are displayed. These components are
associated with the corresponding port, RAID group, or MP blade
selected in the Statistics section. You can plot their usage graphs
in the Chart Work Area.
5
Related Topics
• “Configuring dashboard threshold settings” on page 122
• “Specifying the top 20 consumers” on page 125
• “Dashboard threshold metrics” on page 126
• “Viewing dashboard” on page 128
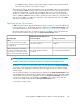
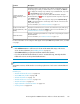
Configuring dashboard threshold settings
IMPORTANT:
• Since, the CHIP/CHA and the ACP/DKA MPs are moved to the MP blades in the P9000 disk arrays,
the CHA Util (%) and the DKA Util (%) metrics are not applicable for the P9000 disk arrays. These
metrics are only applicable for the XP disk arrays.
• You must log in as the default Administrator or as a user with administrator privileges to configure
the dashboard threshold settings.
To enter the dashboard threshold limits for the XP and the P9000 disk arrays:
Monitoring performance of XP and P9000 disk arrays122