
HP StorageWorks P9000 Performance Advisor Software v5.3 User and Troubleshooting Guide (T1789-96322, August 2011)


1. Do one of the following:
Click Settings in the left pane.
OR
Click Edit Threshold on the Dashboard screen. The Dashboard screen appears by default when
you launch P9000 Performance Advisor or when you click Dashboard in the left pane.
The Threshold Settings screen appears displaying one of the following based on whether P9000
Performance Advisor is monitoring both the XP and the P9000 disk arrays or either of them in
your setup:
• If both the XP and the P9000 disk arrays are monitored, the Threshold Settings for XP disk
array and the Threshold Settings for P9500 disk array tables are displayed.
NOTE:
The P9500 Disk Array belongs to the P9000 disk array family.
Consumers are also referred to as components.
• If either the XP or the P9000 disk arrays are monitored, only the threshold settings table for
the monitored array type is displayed.
For more information on the categories displayed for the XP or the P9000 disk arrays, see Table
6 on page 119.
To view a description of the metrics, see “Dashboard threshold metrics” on page 126.
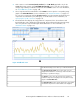
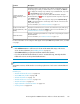
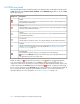
Figure 9 Threshold Settings screen
.
2. Click the text box corresponding to a metric and category whose overall usage summary you
want to view.
For example, to view the overall usage status of an XP disk array in the Backend category, set
the threshold limits for the backend metrics, such as the RG Util (%) and the DKA Util (%) metrics.
HP StorageWorks P9000 Performance Advisor Software User Guide 123