
HP StorageWorks P9000 Performance Advisor Software v5.3 User and Troubleshooting Guide (T1789-96322, August 2011)


the P9000 disk arrays, and the average usage summary of components, specify the threshold
limit for at least one metric in the respective category.
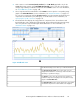
The changes you make on the Threshold Settings screen are immediately reflected on the Dashboard
screen. By default, P9000 Performance Advisor retrieves data for the past six hours from the time you
saved the threshold settings. It considers the management station time to calculate the threshold
duration. For example, if the threshold duration is 6 hrs and the current time on your management
station is 5:00 PM, P9000 Performance Advisor considers the usage summary of components for the
past six hours (11:00 a.m. – 5:00 p.m) to display the overall usage status for the XP or the P9000
disk array on the Dashboard screen.
Specifying the top 20 consumers
P9000 Performance Advisor displays the maximum X busiest consumers or components (default 20)
for a port, RAID group, or an MP blade. This data is displayed in the Component Information section
of the Dashboard screen. For more information, see “Dashboard busiest consumers” on page 135.
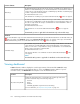
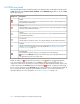
The following table lists the types of consumers, the factors considered to arrive at the maximum X
busiest consumers, and their sorting order in the Components Information section.
Sorting of consumers
Maximum and least X busiest con-
sumers based onConsumer type
The average read and write response time
of LDEVs
The average read and write response time
values are considered
LDEVs
A consumer can belong to the LDEVs
consumer type if it is associated with a port
or a RAID group
The average MP blade utilization
The average MP blade utilization is
considered
LDEVs, journal groups, or the E-LUNs
A consumer can belong to the LDEVs,
journal groups, or the E-LUNs consumer
type if it is associated with an MP blade
NOTE:
The LDEVs, journal groups, or the E-LUNs are referred as consumers on the Dashboard screen.
By default, the consumers are sorted in a descending order and displayed in the Component Information
section. The consumers with quicker average read and write response time or a high average MP
blade utilization are displayed first, followed by those with higher response time and low average
utilization values.
You can specify the number of consumers that must be displayed in the Component Information section
of the Dashboard screen. The maximum acceptable number is 50 and the minimum acceptable number
is 0. By default, 20 consumers are displayed at a time in the Component Information section when
you click a port, RAID group, or an MP blade in the Statistics section. If there are less than 20
consumers, all of them are displayed in the Component Information section.
To specify the consumer settings:
HP StorageWorks P9000 Performance Advisor Software User Guide 125