
HP StorageWorks P9000 Performance Advisor Software v5.3 User and Troubleshooting Guide (T1789-96322, August 2011)

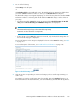
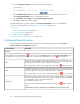

1. Go to the Component Settings section on the Threshold Settings screen.
2. From the Maximum Components list, select the maximum number of consumers you want to view
in the Component Information section of the Dashboard screen.
3. Select Ascending or Descending as the Sort by Average Response Time.
4. Click Save to update the consumer settings.
The maximum X busiest consumers appear in the Component Information section on the Dashboard
screen. For more information, see “Dashboard busiest consumers” on page 135.
Related Topics
• “Dashboard threshold metrics” on page 126
• “Viewing dashboard” on page 128
• “Dashboard charts” on page 137
• “High watermark in dashboard charts” on page 139
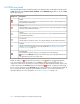
Dashboard threshold metrics
The following table describes the metrics that appear on the Threshold Setting screen in the Frontend,
Cache, Backend, and the MP Blade categories.
DescriptionScreen elements
Frontend
If any of the ports or the CHA MPs usage (applicable only for the XP disk arrays) exceeds the defined threshold limit during the specified
threshold duration for a frontend metric, the status icon appears in the Frontend category in the XP/P9000 Array Health section.
For example, if the usage of a port for the IOPS metric exceeds the defined threshold even once, the status icon appears.
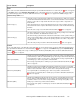
The IOPS threshold value indicates the average I/Os that you define an individual port can
handle over a specified duration. P9000 Performance Advisor uses this value to verify whether
the average I/Os on each port is within or beyond the set threshold.
If the average I/Os on a port exceeds the defined threshold limit, the status icon appears.
IOPS
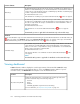
The MBPS threshold value indicates the average MB/s that you define an individual port can
handle over a specified duration. P9000 Performance Advisor uses this value to verify whether
the average MB/s value on each port is within or beyond the set threshold.
If the average MB/s on a port exceeds the defined threshold limit, the status icon appears.
MBPS
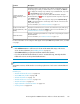
The CHA Util (%) threshold value indicates the average overall MPs utilization on an installed
CHA. P9000 Performance Advisor uses this value to verify whether the average overall utilization
of each CHA MP is within or beyond the set threshold.
The default threshold value is 70%.
If the utilization of one CHA MP exceeds the defined threshold limit, the status icon appears.
NOTE:
The CHA Util (%) metric is applicable for the CHA MPs only on the XP disk arrays.
CHA Util (%)
Monitoring performance of XP and P9000 disk arrays126