
HP StorageWorks P9000 Performance Advisor Software v5.3 User and Troubleshooting Guide (T1789-96322, August 2011)

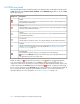

DescriptionScreen elements
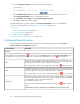
Cache
If the cache exceeds the defined threshold limit during the specified threshold duration for a cache metric, the status icon appears
in the Cache category in the XP/P9000 Array Health section of the Dashboard screen. For example, if the cache write pending for
the Write Pending (%) metric exceeds the defined threshold even once, the status icon appears in the Cache category in the
XP/P9000 Array Health section.
The Cache Usage (%) threshold value indicates the total cache that you define to be utilized
for both the frontend and backend transactions over the threshold duration. P9000 Performance
Advisor uses this value to verify whether the total cache usage is within or beyond the set
threshold limit.
The frontend transactions comprise data transfers between the cache and the frontend ports.
The backend transactions comprise data transfers between the cache and the LDEVs through
the DKAs.
When the cache usage exceeds the defined threshold limit, the status icon appears.
Cache Usage (%)
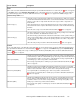
The Write pending metric comprises the number of writes that are pending to be written from
the cache to the LDEVs. The default threshold value is 28%.
The Write Pending (%) threshold value indicates the total number of write operations that you
define can be pending with the cache over the threshold duration. P9000 Performance Advisor
uses this value to verify whether the total write pending operations are within or beyond the
set threshold limit.
When the write pending exceeds the defined threshold limit, the status icon appears.
Write Pending (%)
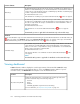
Backend
If any of the RAID groups or the DKA MPs usage (applicable only for the XP disk arrays) exceeds the defined threshold limit during
the specified threshold duration for a backend metric, the status icon appears in the Backend category in the XP/P9000 Array
Health section. For example, if the usage of a RAID group for the RG Seq Reads (IOPS) metric exceeds the defined threshold even
once, the status icon appears.
The RG seq frontend reads (IOPS) threshold value indicates the average sequential backend
read tracks that you define an individual RAID group can manage over the threshold duration.
P9000 Performance Advisor uses this value to verify whether the average sequential I/Os on
each RAID group is within or beyond the set threshold limit.
If the average sequential I/Os on a RAID group exceeds the defined threshold limit, the
status icon appears.
RG Seq Reads (IOPS)
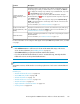
The RG nonseq frontend reads (IOPS) threshold value indicates the average non-sequential
backend read tracks that you define an individual RAID group can manage over the threshold
duration. P9000 Performance Advisor uses this value to verify whether the average
non-sequential I/Os on each RAID group is within or beyond the set threshold limit.
If the average non-sequential I/Os on a RAID group exceeds the defined threshold limit, the
status icon appears.
RG NonSeq Reads (IOPS)
The RG writes (IOPS) threshold value indicates the average sequential backend write tracks
that you define an individual RAID group can manage over the threshold duration. P9000
Performance Advisor uses this value to compare whether the average writes (I/Os) on each
RAID group is within or beyond the set threshold limit.
If the average writes (I/Os) on a RAID group exceeds the defined threshold limit, the status
icon appears.
RG Writes (IOPS)
HP StorageWorks P9000 Performance Advisor Software User Guide 127