
HP StorageWorks P9000 Performance Advisor Software v5.3 User and Troubleshooting Guide (T1789-96322, August 2011)
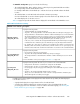

• “Utilization Summary” on page 213
• “10 busiest LDEVs/Ports” on page 231
• “10 busiest LDEVs/RAID groups” on page 232
• “Port summary” on page 235
• “Viewing LDEV data” on page 238
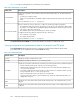
Viewing MP blade utilization for P9000 disk arrays
Click an MP blade ID in the MP Blades Util% group box under the Performance View tab to view the
corresponding utilization summary on the MP Blades screen. You can also click MP Blades in the
component selection tree.
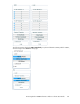
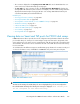
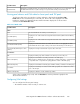
The following image shows the MP Blades Util% group box.
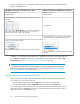
If you click an MP blade ID (for example, MPB-1MA) in the MP Blades Util% group box:
The following details are displayed by default on the MP Blades screen (see Figure 14 on page 224):
• Summary of average MP blade utilization in the MP Blade Summary <MP_blade_ID> table
• Processing types and their utilization of the MP blade in the Processing Distribution <MP_blade_ID>
table
• Top 20 consumers (components) for the MP blade in the Top Components <MP_blade_ID> table
Where, <MP_blade_ID> refers to the MP blade that you selected. For more information, see Table
9 on page 225.
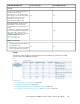
If you click MP Blades in the component selection tree or want to view the utilization summary for
another MP blade:
On the following MP Blades screen, you must click an MP blade ID in the MP Blade Configuration
group box (see Figure 14 on page 224) to view the above-mentioned list.
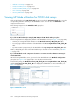
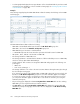
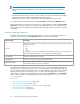
In the following image, the MP Blade Summary <MP_blade_ID>, Processing Distribution <MP_blade_ID>,
and the Top Components <MP_blade_ID> are displayed for MPB-1MA. For more information, see
Table 9 on page 225.
Figure 14 MP Blades screen
.
Viewing XP and P9000 disk array components224