
HP StorageWorks P9000 Performance Advisor Software v5.3 User and Troubleshooting Guide (T1789-96322, August 2011)
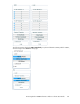
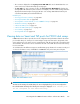

The MP Blade Configuration group box includes the following:
• The installed MP blades, DKCs, and the clusters to which they belong. Each MP blade ID includes
the corresponding cluster # and the blade location.
For example: MPB-1MA is the MP blade ID, 1 indicates the cluster #, and MA indicates the blade
location.
• The individual MPs on each MP blade and each MP's utilization percentage.
Click an individual MP to view the utilization graph in the Chart Work Area. By default, the utiliz-
ation data displayed is for the last one hour.
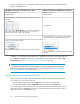
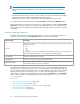
Table 9 on page 225 provides the details that are displayed for an MP blade on the MP Blades screen:
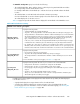
Table 9 MP blade utilization summary
DescriptionMP blade screen elements
Displays the following details:
• Selected MP Blade: The selected MP blade ID.
• Avg. Util %: The average utilization of an MP blade by all the associated processing types. The
average utilization is calculated as the utilization of all the individual processors in the MP blade.
The average utilization by each processing type is due to its consumers that are using the CPU
cycles. For example, if 70% is the average MP blade utilization and there are five processing
types, it indicates that on an average, all the CPU cycles are utilized up to 70%.
In the 70%, if 25% constitutes the average MP blade utilization by the Backend processing type,
it indicates that 25% of the CPU cycles are utilized for processing the array backend activities.
• No. of LDEVs, No. of Ext. Vols, No. of Cont. Access Jnl Groups: The number of consumers for the
MP blade, which can be LDEVs, external volumes, and the continuous access journal groups. The
total of the above-mentioned constitutes the total number of consumers for the selected MP blade.
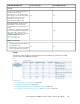
MP Blade Summary
<MP_blade_ID> table
Displays the following details:
• Processing Type: The list of processing types.
• Avg. Util%: The average MP blade utilization by each processing type.
The average utilization is calculated as the utilization of all the individual processors in the MP
blade.
For more information on the processing types, see Table 15 on page 306.
Processing Distribution
<MP_blade_ID> table
Displays the following details about the top 20 consumers for the selected MP blade:
• Component ID: The ID of the consumer that is assigned to the MP blade.
• Component Type: The type of consumer (LDEV, journal volume, E-LUN).
• Processing Type: The processing type that is utilizing the selected MP blade to process consumer
requests.
• Avg Util %: The average MP blade utilization by the consumer.
The top 20 count is derived based on each consumer's average utilization of the CPU cycles
achieved through the associated processing type.
Top Components
<MP_blade_ID> table
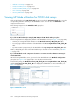
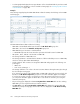
In addition, the following graphs are displayed in the Chart Work Area. By default, the data displayed
is for the last one hour:
• A graph that displays the average utilization of the selected MP blade.
• A stacked area graph that displays the average utilization of the selected MP blade by each
processing type. For more information on how to read the stacked area graph, see “Viewing MP
blade utilization by processing types” on page 306.
HP StorageWorks P9000 Performance Advisor Software User Guide 225