
HP StorageWorks P9000 Performance Advisor Software v5.3 User and Troubleshooting Guide (T1789-96322, August 2011)
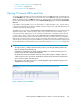
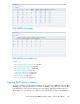
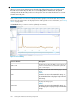
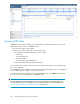
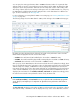

Figure 17 10 busiest front end Ports
.
Related Topics
• “Viewing performance summary” on page 206
• “Viewing CHIP/CHA data” on page 215
• “Viewing ACP/DKA data” on page 220
• “Utilization Summary” on page 213
• “10 busiest LDEVs/RAID groups” on page 232
• “RAID Group summary” on page 233
• “Port summary” on page 235
• “Viewing LDEV data” on page 238
Viewing 10 busiest LDEVs and RAID groups
To view the 10 busiest LDEVs and RAID groups associated with an XP or a P9000 disk array's backend
activities, click BackEndIO in the component selection tree for the XP or the P9000 disk array. The
top 10 busiest LDEVs are displayed under the LDEV tab and the top 10 busiest RAID groups are
displayed under the RG (RAID Group) tab. This data is also displayed when you click the Backend
Total Avg group box under the Performance View tab.
If the number of busiest LDEVs or RAID groups are less than ten or if their utilization is zero, only the
busiest components are displayed. The 10 busiest LDEVs selected is based on the backend transfer
rate and the 10 busiest RAID groups selected is based on the Overall % RAID Group Utilization.
IMPORTANT:
• Under the LDEV tab, you can also view the associated RAID Group for an LDEV. This data helps
determine if more than one LDEV is contributing to a RAID Group activity.
• If the LDEV is a LUSE Master, the details of individual LDEVs are considered for the busiest com-
ponents and not the sum of all the individual LDEVs.
The LDEV response time components, AVERAGE READ RESPONSE, MAXIMUM READ RESPONSE,
AVERAGE WRITE RESPONSE, and MAXIMUM WRITE RESPONSE, are measured in milliseconds.
Click an LDEV ID or RAID group name to view the performance graphs for all the associated metrics
in a chart window. To know more about charts, see “Plotting charts” on page 264.
Viewing XP and P9000 disk array components232