
HP StorageWorks P9000 Performance Advisor Software v5.3 User and Troubleshooting Guide (T1789-96322, August 2011)
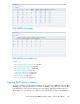
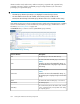
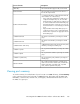
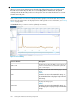
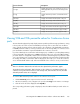
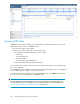
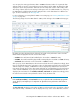
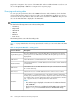

Figure 18 10 busiest backend LDEVs
.
Figure 19 10 busiest backend RAID groups
.
Related Topics
• “Viewing performance summary” on page 206
• “Viewing CHIP/CHA data” on page 215
• “Viewing ACP/DKA data” on page 220
• “Utilization Summary” on page 213
• “10 busiest LDEVs/Ports” on page 231
• “RAID Group summary” on page 233
• “Port summary” on page 235
• “Viewing LDEV data” on page 238
Viewing RAID group summary
To view the summary of overall utilization of RAID groups for an XP or a P9000 disk array, click RG
Summary in the component selection tree for that XP or P9000 disk array. This feature totals the LDEV
I/Os, LDEV MB/s, cache fast write, disk fast write, cache bypass, and backend transfer values for
all the LDEVs on a given RAID group. In addition, it also displays the percentage of the RAID Group
HP StorageWorks P9000 Performance Advisor Software User Guide 233