
HP StorageWorks P9000 Performance Advisor Software v5.3 User and Troubleshooting Guide (T1789-96322, August 2011)

You can query the existing performance data in P9000 Performance Advisor for a particular date
and time stamp to view the corresponding point in time data for all the LDEVs. By default, the data
displayed is for the last performance data collection time stamp and sorted in a descending order.
The sorting of data is based on the average read response time of individual LDEVs. You can query
the LDEV data for a different date and time stamp and also sort the data based on a different sort
type. For more information, see Querying data.
For more information on viewing data for LDEVs in a custom group, see “Viewing LDEV data in custom
groups” on page 256.
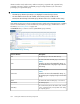
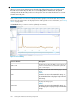
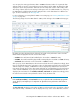
The following image shows the LDEV data for 53036, which belongs to the P9500 Disk Array type.
By default, the values displayed for the following are based on the performance values of all the
LDEVs that are displayed for the last collection time stamp:
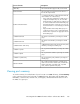
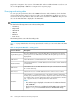
• Total IOs: The total frontend I/Os handled by the selected XP or P9000 disk array.
• Total MBs: The total frontend throughput in MB/s managed by the selected XP or P9000 disk array.
• Total Tracks: The total tracks on the selected XP or P9000 disk array.
After you query for the LDEV data, the above-mentioned total values are updated accordingly, where
they are calculated based on the performance values of all the LDEVs retrieved for the specified date
and time stamp. For example, if 100 LDEV records are displayed by default for the last collection
time stamp, the total values for the above-mentioned fields are calculated based on the performance
values of all the 100 LDEVs. If you query the existing performance data and 50 LDEV records are
displayed, the total values for the Total IOs, Total MBs, Total Tracks are updated accordingly, where
the value shown is based on the performance values of only the 50 records.
IMPORTANT:
If the Total I/O, Total MB/s, and Total Track show zero, it implies that the external RAID group, RAID
group, ThP pool, and snapshot pool components are split between two performance data collection
schedules.
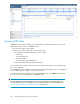
The No of Records displays the total number of LDEV records retrieved for the selected last collection
date and time stamp. 150 LDEV records are displayed in every section of the LDEV table. Click the
HP StorageWorks P9000 Performance Advisor Software User Guide 239