
HP StorageWorks P9000 Performance Advisor Software v5.3 User and Troubleshooting Guide (T1789-96322, August 2011)

DescriptionSections
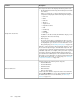
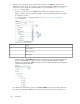
The component selection tree displays the following main nodes:
• The XP and the P9000 disk arrays monitored by P9000 Perform-
ance Advisor.
When you click an XP or a P9000 disk array, the respective
components are displayed under the following main categories:
• Front-end
• Cache
• Back-end
• THP Pool
• Snapshot Pool
• Replication Volumes
• LUSE
• Host Groups
• Ext-RG(s)
• Drive Types
In addition to the above listed, the MP Blades category is also
displayed for the P9000 disk arrays.
• Custom groups
The custom groups that you created appear. When you click
a custom group, all the LDEVs that belong to the custom group
are displayed for your selection. For more information on cre-
ating custom groups, see “Creating custom groups” on page 104.
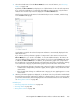
Click the + sign for any of the above-mentioned categories to view
the associated component types and individual components. The
component types can further expand to display the corresponding
individual components. For example, when you click the + sign for
Front-end, it expands to display the Ports component type that
provides the list of individual ports on the selected XP or the P9000
disk array. For more information on selecting components from the
XP and the P9000 disk arrays, or custom groups, see “Selecting
components and metrics” on page 268.
Component selection tree
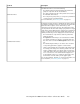
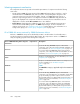
Displays metrics for the following metric categories:
• Frontend IO Metrics
• Frontend MB Metrics
• Utilization Metrics
• Backend Metrics
• Response Time Metrics
Select components from the component selection tree and metrics
from the Choose Metrics box to view their performance graphs in
the Chart Work Area. For more information, see “Choosing
metrics” on page 270.
Choose Metrics box
Using charts262