
HP StorageWorks P9000 Performance Advisor Software v5.3 User and Troubleshooting Guide (T1789-96322, August 2011)

• You have collected the performance data, so that the data on associated components is displayed
under the various categories for the individual XP and P9000 disk arrays.
• The custom groups are created, so that they appear for selection under Custom Groups in the
component selection tree.
IMPORTANT:
• The components are available for selection only if they are configured on an XP or a P9000 disk
array.
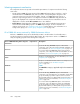
• The following metrics are not applicable for the XP or the P9000 continuous access journal pool
LDEVs:
• FrontEnd IO metric category: LDEV Random Writes and LDEV Sequential Writes
• FrontEnd MB metric category: Random MB Write and Sequential MB Write
• Response Time metric category: Maximum Write Response and Average Write Response
• If you split the journal LDEVs, external RAID group, RAID group, ThP pool, and the snapshot into
two schedules, and in charts, you select Overall LDEVs, the combined data points from both the
schedules are plotted on the chart. In addition, repeated time stamps are displayed if the collection
frequency for both the schedules is the same. As a result, incorrect values are plotted on the graph.
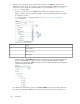
• You can select components that belong to the same or different XP and P9000 disk arrays, or
custom groups. While selecting the components, press the Shift key for sequential selection or the
Ctrl key for random selection of multiple components. Accordingly, related metrics that are common
across the selected components are displayed for your selection in the Choose Metrics box, for
which you can plot the performance graphs in the Chart Work Area.
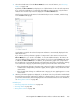
• You can also search for physical LDEVs that belong to an XP or a P9000 disk array. For more
information, see “Searching for components” on page 300.
The following steps outline the procedure for plotting a chart. The links at the end of each step direct
you to additional information related to that task:
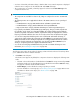
1. Click Charts in the left pane.
The Charts screen appears. By default, the component selection tree displays the following main
nodes:
• The DKC or the model numbers of individual XP and P9000 disk arrays monitored by P9000
Performance Advisor. If user-friendly names are provided for the XP and the P9000 disk arrays,
they appear in brackets beside the DKC numbers.
• Custom Groups, lists the individual custom groups that you created.
For more information on custom groups, see “Creating custom groups” on page 104. For more
information on Charts screen layout, see “Charts screen” on page 260.
HP StorageWorks P9000 Performance Advisor Software User Guide 265