
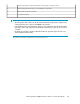
HP StorageWorks P9000 Performance Advisor Software v5.3 User and Troubleshooting Guide (T1789-96322, August 2011)
3. For that host, plot performance graphs of all the LDEVs and identify the LDEV that is contributing
to the observed high response time.
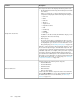
Click the + sign for a main category to navigate through the associated components and view their
performance graphs for the selected metrics. The components of the same type are grouped together.
Each component further expands to a subset of components depending on its level of hierarchy in the
component selection tree. For example, one of the hierarchy of component selection for an XP or a
P9000 disk array under Host Groups is as follows: Host Groups > Individual host groups > Ports >
Individual Ports > LDEVs > Individual LDEVs.
• Host Groups is the main category that displays the individual host groups.
• Each host group displays a set of associated ports that are grouped in the component type, Ports.
• Each port further displays a set of associated LDEVs under the component type, LDEVs.
This logical grouping of components enables easy navigation through different levels of component
types to select and view performance graphs of specific components. In the above example, the ports
are categorized under the host groups. If you notice that the response time of a particular LDEV is
high, drill down to the associated ports to view their performance metrics for the duration when the
LDEV response time is found to be high.
Based on your requirement, select components that belong to different component types under different
categories for multiple XP and P9000 disk arrays, and view their performance graphs for related
metrics in the Chart Work Area.
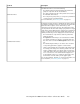
Custom Groups
Custom Groups displays the individual custom groups you created. These custom groups have group
of LDEVs that you want to monitor frequently. Click an individual custom group under Custom Groups
to view the LDEV main category under which all the associated LDEVs are displayed. For more
information on creating custom groups, see “Creating custom groups” on page 104.
Accordingly, related metrics are displayed in the Choose Metrics box. Select a metric and view the
performance graphs of components in the Chart Work Area.
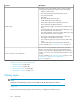
Choosing metrics
When you choose an XP or a P9000 disk array, individual components, or component types in the
component selection tree, a default set of related metrics are displayed for selection in the Choose
Metrics box. The set of metrics displayed vary based on what you choose in the component selection
tree. These metrics can belong to different metric categories and only those metrics applicable to the
selected set of components are displayed.
• The related metrics are displayed in the Choose Metrics box, if you select a homogeneous set of
components, where the selected components belong to the same component type within or across
the XP and the P9000 disk arrays. The related metrics can belong to different metric categories.
For example, only the LDEV related metrics are displayed in the Choose Metrics box, if you choose
Physical LDEVs under Back-end > RAID Groups.
• The common set of metrics are displayed in the Choose Metrics box, if you select a heterogeneous
set of components, where the selected components belong to different component types within or
across the XP and the P9000 disk arrays. If the selected components do not have common metrics,
only the metrics for the latest selected component are displayed in the Choose Metrics box. For
example, if you select CLPR0 and RAID group 1–1, only metrics related to the selected RAID group
1–1 are displayed in the Choose Metrics box.
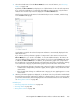
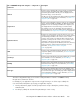
The following image is an example for an XP disk array and shows the default set of metrics that are
displayed based on the component selection.
Using charts270