
HP StorageWorks P9000 Performance Advisor Software v5.3 User and Troubleshooting Guide (T1789-96322, August 2011)

IMPORTANT:
• For a component type, the metrics are displayed for selection only if the corresponding components
are supported or configured in the XP and the P9000 disk arrays.
For example, if the configuration collection is not yet performed for an XP disk array, the CLPR
partition data is not available. Hence, clicking Cache in the component selection tree does not
result in any metrics and the Choose Metrics box is disabled. The same logic applies for other
components in the XP and the P9000 disk arrays. For virtual volumes like the ThP and the snapshot
pools, the respective component type is displayed if the selected XP or the P9000 disk array supports
that particular component configuration.
If a particular component is not supported in an XP or a P9000 disk array, the related metrics are
not displayed in the Choose Metrics box. For example, as CLPRs do not exist in an XP1024 Disk
Array, the Cache related metrics are not supported for that disk array.
• If the selected metrics belong to the same metric category, the performance graphs of components
are plotted in the same chart window.
For example, if you selected port CL1E, LDEV 0:06, and the metrics as Avg Port IOPS and Total
LDEV IO – Frontend, the respective performance graphs are plotted in the same chart window,
as both the selected metrics belong to the Frontend IO Metrics category.
• If the metrics belong to different metric categories, the performance graphs are automatically
plotted in different chart windows.
For example, if you selected port CL1E and the metrics as Avg Port IOPS and Avg CHA MP Util
(%), the respective performance graphs are plotted in two separate chart windows, as the metrics
selected belong to different metric categories. The Avg Port IOPS belongs to the Frontend IO
Metrics category and the Avg CHA MP Util (%) belongs to the Utilization Metrics category.
• If you select a metric for a component type, the performance graphs are displayed for all the as-
sociated components in the same chart window. For example, if you select the Overall RAID Group
Utilization metric for the Back-end > RG(s) component type, the performance graphs of all the
associated RAID groups are displayed in a single chart window.
• You can add performance graphs of components for similar metrics to the same chart window
only if the chart selection is retained in the Chart Work Area. If the existing chart window is not
active, a new chart window is added to the Chart Work Area.
For example, the performance graph of port CL1E is already plotted for the metric Avg Port IOPS
and you choose to plot performance graph of another port CL1F for the same metric. The perform-
ance graph of CL1F is automatically added to the existing chart window that already has perform-
ance graph plotted for CL1E. If the existing chart window is not active, the performance graph
for CL1F is plotted in a new chart window.
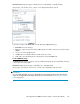
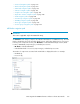
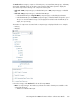
If you want to view additional metrics for the components, click more... in the Choose Metrics box.
The metrics displayed are categorized based on the metric category to which they belong. You can
select a metric and click Done to view the corresponding performance graph in the Chart Work Area.
You can also click Select All, if you want to view performance graphs for all the metrics listed. Click
Hide to close the additional Choose Metrics dialog box.
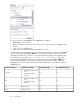
Front-end navigation path
For the XP disk arrays
The Front-end main category comprises of the ports that further displays the associated MPs and
CHAs. Following is the component selection path:
Using charts272