
HP StorageWorks P9000 Performance Advisor Software v5.3 User and Troubleshooting Guide (T1789-96322, August 2011)
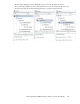
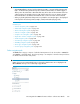
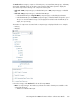

In the above image, under Cache for the XP disk array 10055:
• Cache is the main category. The number (6) indicates the number of CLPRs partitions configured
on the selected XP disk array.
• The CLPR0 and CLPR1 are the individual CLPRs.
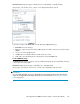
The related metrics associated with the Cache and CLPRs are displayed in the Choose Metrics box.
Select the metrics at the component type or the individual component levels, or both to view the related
performance graphs in the Chart Work Area. For a description of these metrics, see “Metric Category,
metrics, and descriptions” on page 441.
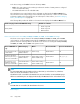
The following table provides the default set of metrics that are displayed in the Choose Metrics box.
Default set of metricsCache category for XP and P9000 disk arrays
• Cache Usage MB
• Cache Usage Util
• CLPR Read Hits
Cache, CLPRs
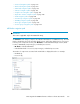
Chart screen selections for the P9500, XP24000, XP20000, XP12000, and XP10000 Disk Arrays
The Charts screen supports charts for the P9500, XP24000, XP20000, XP12000, and XP10000
cache partitions. For the XP1024/128 Disk Array, the Resource list box displays All for viewing cache
partition charts. The following table lists the Chart screen selections for viewing the P9500, XP24000,
XP20000, XP12000, and XP10000 cache partition charts.
Resource List ContentsResource List TitleMetricMetric CategoryXP or P9000 disk ar-
ray
AllCache PartitionCache Usage
Frontend MB Metrics or
Utilization Metrics
Any disk array model or
serial number
All, 0, 1, 2, 3, ...Cache Partition
Cache Write Pending or
Cache Sidefile Usage
Frontend MB Metrics or
Utilization Metrics
An P9500, XP24000,
XP20000, XP12000, or
XP10000 serial number
AllCache Partition
Cache Write Pending or
Cache Sidefile Usage
Frontend MB Metrics or
Utilization Metrics
A non-P9500 or non-
XP24000, XP20000,
XP12000 serial number
NOTE:
For an XP10000 Disk Array, the MIX boards do not have MP4, 5, and 6 defined. So, when these
metrics are chosen, the utilization is shown as zero.
The Utilization metric is available for the DKAs that are associated with the concatenated RAID groups.
All the associated DKA pairs are displayed individually in the Resource list box on the Charts screen.
TIP:
For CHIPs that are not installed, the MP utilization shows zero.
Related Topics
Using charts276