
HP StorageWorks P9000 Performance Advisor Software v5.3 User and Troubleshooting Guide (T1789-96322, August 2011)
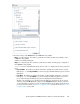

IMPORTANT:
When you plot the performance data points for a RAID group, the associated drive type is also
displayed in the legend for the selected RAID group (Drive Type:<drive type value>). For example:
Drive Type: DKR2E-J146FC.
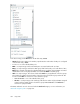
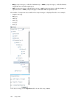
The related metrics associated with the component types and individual components in the Back-end
category are displayed in the Choose Metrics box. Select the metrics at the component type or the
individual component levels, or both and view the related performance graphs in the Chart Work
Area. For a description of these metrics, see “Metric Category, metrics, and descriptions” on page 441.
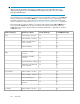
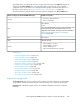
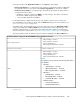
The following table provides the default set of metrics that are displayed in the Choose Metrics box
for the XP and the P9000 disk arrays. The Yes and No under For the XP disk arrays and For the
P9000 disk arrays columns indicate whether the particular default metric is applicable for that XP or
P9000 disk array.
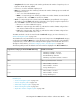
For P9000 disk arraysFor XP disk arraysDefault set of metricsBack-end category
YesYesACP Total IO/s – FrontendDKA
YesYesACP Total MB/s – Frontend
YesYes
ACP Pair Sequential Read
Tracks – Backend
NoYesACP Pair Utilization
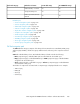
YesYes
RAID Group Total IO/s –
Frontend
RG(s)
YesYes
RAID Group Total MB/s –
Frontend
YesYesOverall RAID Group Utilization
YesYes
RAID Group Sequential Read
Tracks – Backend
YesYesLDEV Total IO/s – FrontendPhysical LDEVs
YesYesLDEV Total MB/s – Frontend
YesYesAverage Read Response
YesYes
LDEV Sequential Read Tracks –
Backend
YesYesLDEV Total IO/s – FrontendPool LDEVs
Using charts282