
HP StorageWorks P9000 Performance Advisor Software v5.3 User and Troubleshooting Guide (T1789-96322, August 2011)
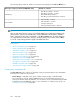
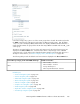

The following table provides the default set of metrics that are displayed in the Choose Metrics box.
Default set of metricsDrive Types category for XP and P9000 disk arrays
• RAID Group Total IO/s – Frontend
• RAID Group Total MB/s – Frontend
• Overall RAID Group Utilization
• RAID Group Sequential Read Tracks – Backend
RAID Groups
• LDEV Total IO/s – Frontend
• LDEV Total MB/s – Frontend
• Average Read Response
• LDEV Sequential Read Tracks – Backend
Physical LDEVs
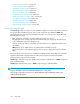
NOTE:
There are other metrics that you can choose for both the RAID groups and the physical LDEVs in the
following metric categories: Frontend IO metrics, Frontend MB metrics, Backend metrics, Utilization
metrics, and Response Time metrics. Click more... in the Choose Metrics box. The metrics displayed
are categorized based on the metric category to which they belong. Select a metric and click Done
to view the corresponding performance graph in the Chart Work Area.
Related Topics
• “Front-end navigation path” on page 272
• “Cache navigation path” on page 275
• “MP Blades navigation path” on page 277
• “Back-end navigation path” on page 278
• “THP Pool navigation path” on page 283
• “Snapshot Pool navigation path” on page 285
• “LUSE navigation path” on page 290
• “Replication Volumes navigation path” on page 288
• “Host Groups navigation path” on page 292
• “Ext-RG(s) navigation path” on page 294
• “Custom groups navigation path” on page 298
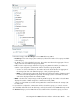
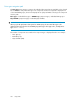
Custom groups navigation path
The Custom Groups node comprises of individual custom groups that display the associated LDEVs.
Following is the component selection path:
• Custom Groups > Individual custom group > LDEVs (component type) > Individual LDEVs
The serial numbers of the XP and the P9000 disk arrays to which the LDEVs belong are also
mentioned in brackets beside the LDEV IDs. You can create a custom group that has multiple LDEVs
from different XP and P9000 disk arrays. For more information on creating custom groups, see
“Creating custom groups” on page 104.
Using charts298