
HP StorageWorks P9000 Performance Advisor Software v5.3 User and Troubleshooting Guide (T1789-96322, August 2011)
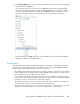
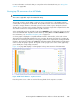
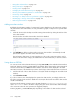

2. In the Physical LDEV text box, enter the name of the LDEV that you want to search in the CU:LDEV
format and click the Search icon.
The component selection tree for the XP or the P9000 disk array that has the matching LDEV
component automatically expands to display the LDEV highlighted for your reference. (If there
are many components listed for the selected XP or P9000 disk array, you may have to use the
scroll bar to navigate through the list of components to view the matching component).
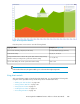
In the above image, a P9000 disk array is selected and the search for the physical LDEV 0:05
displays that it belongs to the RAID Group 1–2.
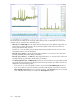
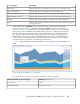
Viewing charts
The Chart Work Area displays the performance graphs of components in individual chart windows.
By default, each chart window represents one of the five metric categories that P9000 Performance
Advisor supports. The Chart Work Area consists of the following:
• The individual chart windows that display the performance graphs of components for the selected
metrics. By default, the Chart Work Area accommodates three chart windows in a single column.
The new chart windows are added to the next column.
If you align the Chart Work Area layout horizontally, it can accommodate four chart windows in
a row. The new chart windows are added to the next row. The scroll bar is automatically enabled
and takes you to the row where the new chart window appears.
• The Chart controls that you can use to perform various tasks on the individual chart windows. For
more information, refer to the tasks list provided at the end of this topic.
• The Zoom preview panel, where you can preview the performance of components for a specified
duration. You can also directly zoom in across set of data points in a chart window.
HP StorageWorks P9000 Performance Advisor Software User Guide 301