
HP StorageWorks P9000 Performance Advisor Software v5.3 User and Troubleshooting Guide (T1789-96322, August 2011)
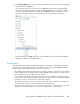
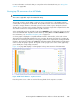
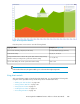

The Chart Work Area displays the following default settings. They are applicable across the chart
windows until you select the other available options:
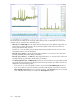
• Time Line in the Chart Style list. This implies that the data points for the different components are
plotted as a line graph. The breaks in the performance graphs can be observed, if there are
missing performance data collection.
• Duration as 1 hour. By default, only the data points that are plotted for the last one hour of the
management station's time are displayed.
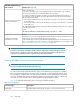
• Forecast displays None for an XP disk array implies that there is no forecast on the cache write
pending, MP, DKA, RG, and the ThP pool utilization.
Forecast displays None for a P9000 disk array implies that there is no forecast on the cache write
pending, RAID group, MP blade, and the ThP pool utilization.
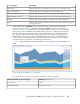
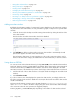
• The Show Legends, Zoom, and Data points check boxes are selected. The corresponding Legends
list and the Zoom preview panel are displayed in all the chart windows. The data points are also
displayed in the performance graphs.
• If you want to see only a line graph, clear the selection for the Show Data points check box.
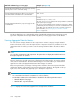
• If you do not want to view the Zoom preview panel and the Legends list, clear the respective
Show Legends and Zoom check box selections. However, if the Legends check box is selected
in the individual chart window, it overrides the Show Legends selection.
Using charts302