
HP StorageWorks P9000 Performance Advisor Software v5.3 User and Troubleshooting Guide (T1789-96322, August 2011)
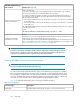

NOTE:
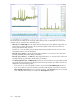
• These selections work only on the active chart windows.
• If the total number of data points from all the performance graphs exceeds 500 in a chart
window, the data points are not rendered to optimize the charting functionality in P9000
Performance Advisor. You can hover the pointing device over the line graphs to view the data
points.
• The performance or utilization graphs for inactive components will only have the start and
end data points plotted in the chart window, and connected by a straight line.
• For every individual component the percentile value is displayed in the tooltip.
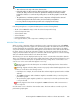
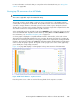
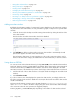
Place the pointing device on a particular data point to view the following details:
• The XP or the P9000 disk array to which the selected component belongs
• Selected component name
• Selected metric name
• Selected duration
• Current performance value
• Drive type information, if the component is a RAID group or LDEV
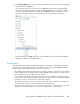
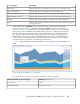
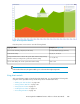
Individual Chart windows
When you select components and associated metrics in the component selection tree under Charts,
the corresponding performance graphs are automatically plotted in the Chart Work Area. The chart
window that displays the performance graphs appears selected (active chart window). By default,
every chart window in the Chart Work Area appears selected. The title of the chart window indicates
the metric category for which the performance graphs are plotted. The number besides the metric
category in the title indicates the sequence in which the chart windows appear. You can also rearrange
and resize individual chart windows in the Chart Work Area.
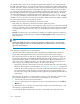
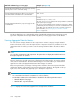
The following icons are also displayed at the top left corner in a chart window beside the chart title.
These icons indicate the current status of the graphs plotted in the chart window and change for every
component for which the data points are plotted. Hover the pointing device over the status icon to
view the error or the current status that appears in a tool tip.
•
(Normal): Appears when the data points are rendered and displayed in the chart windows
without any errors.
•
(Warning): Appears when the data points are not properly rendered and displayed in the chart
windows. It can be due to the following reasons:
• Invalid input. For example, the selected start date and time might be greater than the end date
and time.
• The P9000 Performance Advisor database might be unavailable when you tried to plot the
performance graphs.
• The performance graphs might be plotted for a component, for which the performance data
is not yet collected.
•
(Critical): Appears when the HP StorageWorks P9000 Performance Advisor Tomcat service
does not respond.
Click the status icons to refresh the chart windows status. The chart windows re-render to plot the
performance graphs again.
HP StorageWorks P9000 Performance Advisor Software User Guide 303