
HP StorageWorks P9000 Performance Advisor Software v5.3 User and Troubleshooting Guide (T1789-96322, August 2011)

For more information on the tasks that you can perform in the Chart Work Area, see “Using chart
controls” on page 309.
Viewing top 20 consumers of an MP blade
IMPORTANT:
This section is applicable only for the P9000 disk arrays.
The top 20 consumers can be LDEVs, continuous access journal groups, or the E-LUNs (external
volumes) that are assigned to an MP blade. The top 20 consumers count is derived based on each
consumer's average utilization of the CPU cycles across the collection cycles during the selected
duration. Those consumers whose average utilization percentage is high when compared to the other
associated consumers are categorized as the top 20 consumers.
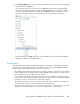
Select an MP blade ID (cluster #, blade location) from MP Blades in the component selection tree and
choose the MP Blade Util - Top 20 Consumers metric by clicking more in the Choose Metrics box. For
more information, see “MP Blades navigation path” on page 277.
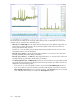
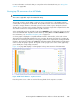
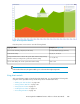
A column graph is displayed in a separate Utilization Metrics chart window, where each column
depicts the average MP blade utilization by each consumer. The X-axis represents the consumer IDs
(includes the consumer type and the processing type) and the Y-axis represents the average MP blade
utilization. The chart title includes the P9000 disk array DKC number, the MP blade ID, and the metric
name for which the graph is plotted. The legends on the top right corner of the column graph helps
you to identify the corresponding consumers.
Figure 25 on page 305 displays a column graph for the top 20 consumers of the MPB-1MA.
Figure 25 MP blade utilization - top 20 consumers
.
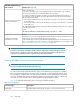
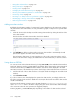
Place the pointer over a column to view the following details for the respective consumer:
HP StorageWorks P9000 Performance Advisor Software User Guide 305